

Last updated on December 31st, 2025 at 12:40 am
Introduction
Millennials and Gen Z are often heard discussing one or more of the 11 topics covered in this article. More often than not, that “knowledge” comes from friends, social media, headlines, or viral posts rather than from primary sources or real-world experience. This is how myths begin—and how they spread. This article will debunk 11 housing affordability myths.
Many myths passed around online have little consequence. These do not. The 11 myths examined here have serious real-world implications for the people who believe them and for others who hear them repeated often enough to begin questioning sound advice from professionals with actual knowledge and experience.
Left unchallenged, these narratives shape decisions about careers, debt, housing, and long-term financial security.
RetireCoast is not about creating, promoting, or recycling myths. We have taken a deep dive into each of these 11 topics to present the unvarnished truth—supported by data, historical context, and clearly identified sources.
Every one of the myths discussed here is negative in nature, and together they have contributed to the discouragement and pessimism many millennials express about homeownership and financial progress.
Our goal is simple: to replace frustration with clarity. By shining light on these misconceptions, we believe millennials and Gen Z who read this article will walk away better informed, more confident, and far more optimistic about their ability to buy a home and build a stable financial future.
- Big corporations are buying up all the homes — The belief that Wall Street firms dominate single-family housing and are locking regular buyers out of the market.
- Mortgage rates are historically unaffordable — The assumption that today’s rates are extreme and make buying financially reckless compared to waiting.
- CEO pay is driving housing costs — The idea that executive compensation is a major cause of high home prices and stagnant wages.
- Corporations don’t pay enough taxes — The belief that raising corporate taxes would reduce prices and inequality without affecting consumers.
- You must have 20% down to buy a home — The outdated assumption that homeownership is impossible without a large down payment.
- Immigration is the main cause of housing shortages — The claim that undocumented or large-scale immigration is primarily responsible for unaffordable housing.
- Millennials and Gen Z are permanently priced out — The narrative that younger generations will never be able to own homes regardless of planning or effort.
- There is no affordable housing left anywhere — The belief that affordable homes no longer exist in the U.S. housing market.
- Student debt means you’ll never recover financially — The assumption that student loans permanently prevent wealth-building and homeownership.
- Renting is always throwing money away — The idea that renting is inherently foolish and buying is always financially superior.
- The system is completely rigged — The belief that the economy is so stacked against regular people that individual choices no longer matter.
- Introduction
- Exploding the Myths of Housing Affordability
- Myth #1: Big Corporations Like BlackRock Are “Buying Up All the Homes”
- Myth #2: Today’s Mortgage Rates Are Sky-High and Historically Unaffordable
- Housing Affordability in 2025 vs 1985
- Myth #3: CEO Pay and Corporate Greed Are Driving Up Housing Costs and Stagnant Wages
- Myth #4: Big Corporations Aren’t Paying Enough in Taxes (and Higher Corporate Taxes Would Solve Inequality Without Hurting Regular People)
- Myth #5: You Need 20% Down to Buy a House—Otherwise, It’s Impossible
- Myth #6: Immigration (Especially Undocumented) Is the Main Reason Housing Is Unaffordable
- Myth #7: Millennials and Gen Z Are Priced Out of Housing Forever
- Myth #8: There’s No Affordable Housing Left Anywhere
- Myth #9: Student Debt Means You’ll Never Recover Financially
- Myth #10: Renting Is Always “Throwing Money Away”
- Myth #11: The System Is Completely Rigged—You Have No Real Chance
- What is the real problem with housing? Not the myth
- Take the Housing Myths Quiz
- Conclusion: Break Free from the Myths and Build Your Future
- Call to Action: Take Control Today
- FAQ – Frequently Asked Questions about Housing Affordability

Exploding the Myths of Housing Affordability
There are 11 myths.
Myth #1: Big Corporations Like BlackRock Are “Buying Up All the Homes”
This is one of the most viral housing affordability myths among millennials and Gen Z, often fueled by confusing headlines, social media memes, and mix-ups between companies. Let’s break it down clearly. If you want more background on how RetireCoast organizes millennial resources, start here: https://retirecoast.com/millennial-hub/.
BlackRock does not buy or own individual single-family homes. The world’s largest asset manager has repeatedly stated this—it invests primarily in mortgage securities, multifamily developments, and financing for new construction.
Claims to the contrary usually stem from confusion with Blackstone (a separate firm that helped pioneer single-family rentals after the 2008 crisis) or from BlackRock holding small minority stakes (typically 6–7%) in publicly traded rental companies like American Homes 4 Rent.
Some institutional investors do purchase single-family homes, but
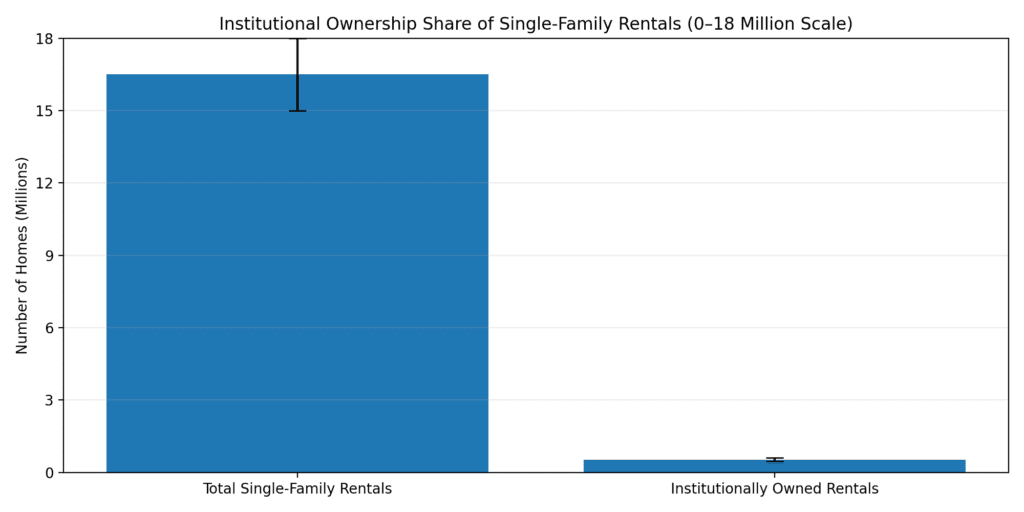
Yes, some large institutional investors do purchase single-family homes to rent out. Firms like Invitation Homes, Progress Residential, and American Homes 4 Rent each own tens of thousands of properties. However, this trend has lost considerable momentum in recent years. Rising home prices, higher interest rates, and tighter inventory have eroded profitability on scattered-site purchases.
Many institutions have pivoted to build-to-rent communities (purpose-built rental neighborhoods) or become net sellers. Recent 2025 data shows institutional buyers (firms with 1,000+ homes) accounting for less than 2% of total purchases nationally.
Many younger buyers also point to small investors—often their own parents’ or grandparents’ generation buying one or two rental properties—as “taking homes off the market.” This does happen, and small “mom-and-pop” investors own the vast majority (~85–90%) of all investor-held properties.
Their overall share of the total housing inventory remains extremely small, and they provide a vital service: rental demand far exceeds new multifamily apartment construction, which has lagged for decades.
Another common belief is that investors routinely outbid first-time buyers by overpaying. In reality, professional investors (large or small) must buy at or below market value to generate profitable rental yields—they can’t consistently overpay and stay in business.
What does give them an occasional edge is all-cash offers, which sellers often prefer for speed and certainty (no financing or appraisal contingencies). Sellers may accept a slightly lower cash bid over a higher financed offer from a first-time buyer to avoid risk. This happens, but it’s far from universal—most sellers prioritize the highest reliable price.
It may seem like there’s a nationwide housing shortage, but there is no single U.S. housing market—there are hundreds of distinct local markets. The severe crunch is concentrated in congested, high-demand metro areas (coastal California, New York, Boston, Seattle, Denver, etc.). Smaller cities, midsize metros, and rural areas have often escaped the worst shortages and maintain healthier inventory levels.
Supply and Demand
Prices are driven by classic supply and demand: millions of millennials and Gen Z prefer the amenities, jobs, and culture of large urban centers, intensifying competition where supply is artificially restricted by zoning and slow building.
The roots of this corporate-buying myth? A few high-profile stories from the pandemic buying frenzy, combined with genuine frustration over low starter-home inventory. In truth, the crisis is overwhelmingly about too few homes built over too many years, not a Wall Street takeover.
Recognizing this shifts focus to practical steps: exploring underrated markets, building career income, or advocating for more construction where you want to live. That’s why this myth matters: it’s one of the most repeated housing affordability myths and it misdirects your energy away from real solutions and real choices.
Myth #2: Today’s Mortgage Rates Are Sky-High and Historically Unaffordable
Many millennials and Gen Z buyers view current mortgage rates as painfully elevated—often calling them “unaffordable” or a major barrier to homeownership. This perception stems from entering the housing market during (or just after) the ultra-low rate era of the late 2010s and early 2020s, when rates dipped below 3%.
But the reality is quite different: today’s rates are actually below the long-term historical average and represent a return to normalcy. This myth remains one of the most repeated housing affordability myths in modern homebuying discussions.
As of late December 2025, the average 30-year fixed-rate mortgage stands at 6.18% (per Freddie Mac’s Primary Mortgage Market Survey for the week ending December 24). Freddie Mac has tracked these rates since 1971, and the overall average from April 1971 through late 2025 is approximately 7.7–7.8%.
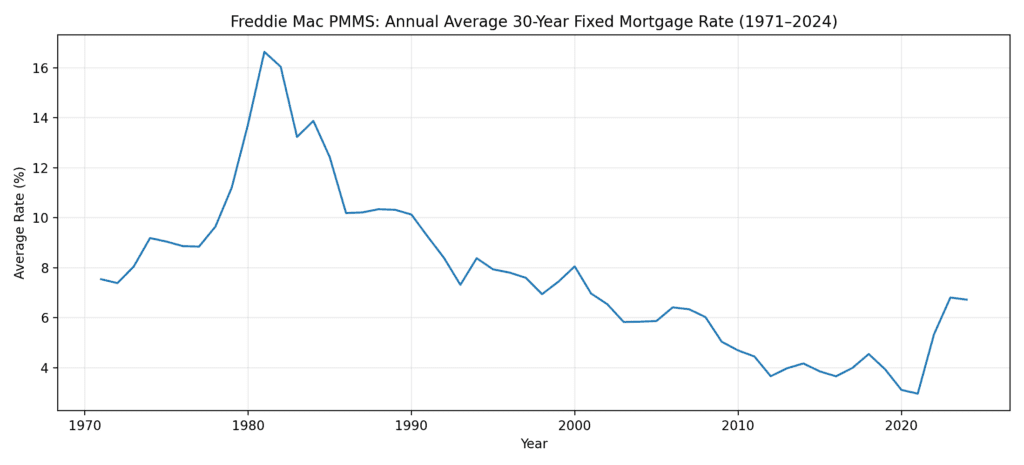
Average U.S. 30-year fixed mortgage interest rates from 1971 through 2024 based on Freddie Mac’s Primary Mortgage Market Survey (PMMS), illustrating the 1981 peak, the pandemic-era low, and today’s return to historically normal levels.
Rates have reached extreme highs in the past: the all-time peak hit 18.63% in October 1981 amid double-digit inflation and aggressive Federal Reserve tightening. The lowest point was 2.65% in January 2021, driven by pandemic-era stimulus and economic uncertainty.
The sub-3% rates many younger buyers remember were an aberration—a once-in-a-generation low fueled by unique circumstances (global pandemic, massive Fed intervention) unlikely to repeat anytime soon. Similarly, the 18% highs were a product of 1980s economic turmoil.
Today’s ~6.2% level is not only below the historical norm but aligns closely with rates from the 1990s and 2000s, periods of strong housing market growth.
The extraordinary conditions that drove rates under 3% (near-zero Fed policy, economic shutdown) no longer exist, and persistent factors like moderate inflation and steady growth suggest rates will remain elevated compared to the 2020–2021 anomaly.
Waiting solely for a big rate drop could backfire. If home prices continue rising in your market (as they have in many areas due to ongoing supply shortages), even a modest rate decline might not offset the higher purchase price—leaving you with similar or larger monthly payments. For example, a 0.5–1% rate drop on a more expensive home often fails to “catch up” to the appreciation.
Housing Affordability in 2025 vs 1985
Many Millennial parents were buying their first home in 1985. The data below indicates that they faced about the same issues that Millennials face today. In fact, the comparison is nearly identical, just trading issues. This chart below should put this into perspective for our readers.
To enable a fair comparison, 1985 figures are adjusted for inflation using CPI data (multiplier ≈ 3.03× based on BLS data from 1985 to late 2025).
- Real home prices are higher in 2025: Adjusted for inflation, median homes cost substantially more today, worsening the price-to-income ratio.
- Incomes have grown, but lagged: Real median income is up, yet the gap with prices has widened.
- Lower down payments help entry: In the 1980s, buyers typically needed 25–28% down. Today, averages are lower (19% overall, ~10% first-time) due to FHA and conventional low-down options.
- Lower rates dominate payments: Lower rates and smaller down % make monthly costs a smaller share of income in 2025 (~29–35%) vs. 1985 (~40%).
- Mixed verdict: Entry can feel harder (bigger nominal down payment needed even at lower %), but for qualified buyers, ongoing affordability is improved in 2025 thanks to dramatically lower rates and more flexible down payment requirements.
Locking in now or soon
There are valid reasons to delay buying (e.g., building savings, career moves, or waiting for more inventory). But interest rates alone shouldn’t be one of them—they’re already at historically reasonable levels. Locking in now (or soon) allows you to build equity, and you can always refinance later if rates do fall meaningfully.
Understanding this context helps shift focus to actionable steps, like improving credit, exploring affordable markets, or leveraging low-down-payment options. If you want tools that turn this into real math, use: /calculators-hub/. Clearing up housing affordability myths means replacing fear with numbers.
Myth #3: CEO Pay and Corporate Greed Are Driving Up Housing Costs and Stagnant Wages
Let’s start with a clear acknowledgment: skyrocketing CEO compensation has little to nothing to do with housing shortages, home prices, or the broader affordability crisis.
Housing costs are overwhelmingly driven by structural issues like chronic underbuilding, zoning restrictions, and supply-demand imbalances in high-demand areas—not executive pay packages. Again, this is why it belongs in a list of housing affordability myths—it distracts from the real drivers of affordability.
That said, the dramatic rise in CEO pay (often including massive stock awards and bonuses) has far outpaced typical worker wages, creating a tremendous disparity that many find unacceptable and unfair.
CEO-to-worker pay ratios at S&P 500 companies reached 285:1 in 2024 (per AFL-CIO data), up from 20–30:1 in the 1960s–1970s. This gap fuels legitimate frustration, especially when entry-level and hourly wages feel stagnant while executives earn tens of millions.
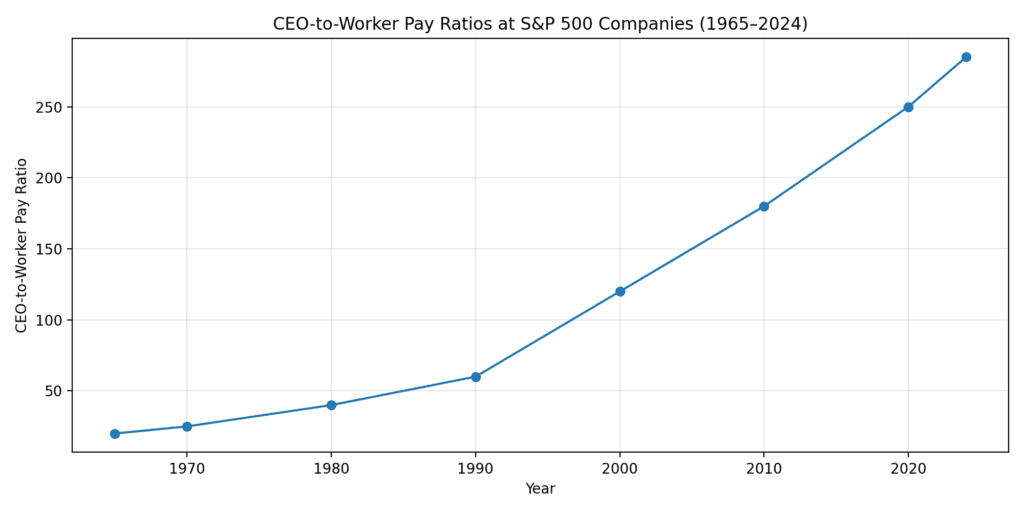
CEO-to-Worker Pay Ratios Have Grown Dramatically Since the 1960s
Source note (optional line under caption): AFL-CIO executive compensation studies; values shown reflect representative historical averages.
Solving this disparity ideally comes through better corporate governance, not heavy government interference in private commerce. Most Americans indirectly own shares in these large companies through 401(k)s, pension plans, mutual funds, and retirement savings—meaning aggressive caps or taxes on executive pay could reduce shareholder returns (including for everyday workers and retirees).
More energy should focus on closing the gap between line managers and the top executives: stronger shareholder “say-on-pay” votes, tying more compensation to long-term performance and worker wage growth, and boards prioritizing equitable incentives.
- 2024 average S&P 500 CEO compensation: ~$18.9 million (AFL-CIO)
- Total for ~500 CEOs: ~$9.45 billion
- U.S. private-sector wages: ~$11.7 trillion annually (BLS 2024)
- Private-sector workers supported: ~130–135 million
This tiny bump wouldn’t meaningfully raise wages, lower inflation, or make housing more affordable.
To bring it home with a relatable example: Imagine the CEO and top executive team of a large national hamburger restaurant chain (think a major fast-food player) suddenly agreed to work for free. All their multi-million-dollar compensation was redirected solely to lowering menu prices.
Even then, the savings passed through to customers would be negligible—a typical hamburger (averaging $14–$15 at restaurants in late 2025) might drop by just a few cents (far less than the 5–10 cents sometimes imagined). Labor, ingredients, rent, and operations dominate costs; executive pay is a drop in the bucket.
The wealth concentration at the top can feel upsetting and look terrible optically—signaling misaligned priorities in a tough economy. But it’s not a major drain sucking money from workers’ pockets or inflating everyday costs like housing or food.
Addressing it through better board oversight and incentives could improve fairness and perceptions without broad economic disruption. Separating real causes from housing affordability myths is exactly what helps people make better decisions.
Myth #4: Big Corporations Aren’t Paying Enough in Taxes (and Higher Corporate Taxes Would Solve Inequality Without Hurting Regular People)
Add this new one: Big corporations are not paying enough in taxes. This is a big myth and one that is usually part of a political parties message to their constituents. This belongs on the list of housing affordability myths because it gets repeated as if it would magically lower costs without affecting consumers.
It’s important to understand what a corporation is. A corporation earns its income from selling goods and services to the public and government. That hamburger just discussed at $14-$15 is priced based upon the corporation’s goals for profitability to return to shareholders enough value to justify their trust.
Pricing for that hamburger is a complex task because so many things must go into the decision such as ingredients, cost of rents, transportation, salaries, benefits and many more.
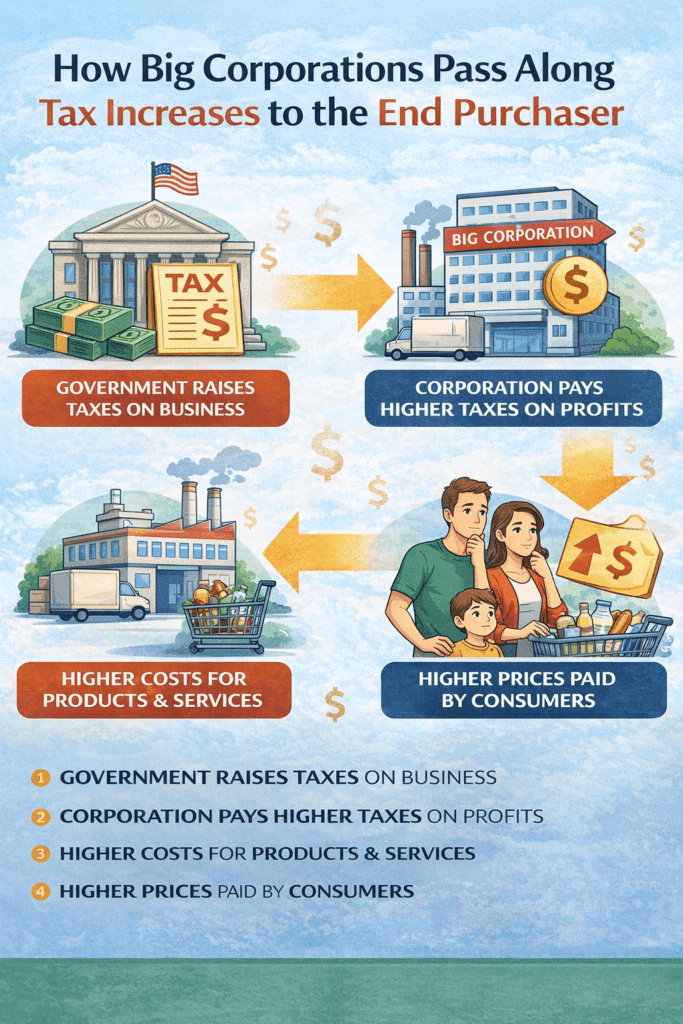
How Corporate Tax Increases Ultimately Raise Prices for Consumers
When that hamburger corporation is taxed at say 10% more, where will they find the money to pay the taxes? You got it, from you. They will reprice the hamburger to earn the extra 10%. The best way to look at corporations is that they pass through all costs to the end buyer of their goods and services. The more they have to pay for anything, the higher the cost to the consumer.
When governments tax corporations, they are effectively taxing you. The difference is that you do not see that tax called out directly in your purchase receipt. Charging corporations higher taxes is a way to hide the real motivation and that is to tax the public without the public being directly aware.
Most of the public does not how economics work
It’s possible that the majority of the public is unaware of how the economics work with taxation and big business. Now you know and can help dispel this myth. This is a major reason housing affordability myths persist—people don’t see how costs pass through.
This myth is a staple in political messaging across party lines: “Make big corporations pay their fair share!” It resonates because corporate profits seem massive while many workers struggle.
But the reality of how corporate taxation works often gets overlooked—and it’s crucial for millennials and Gen Z to understand the economics behind it. For additional millennial-focused financial education and related articles, see: https://retirecoast.com/millennial-financial-hub-2026/.
First, remember what a corporation fundamentally is: a legal entity that sells goods and services to customers (you, me, businesses, and government) with the goal of generating profit for its shareholders. Most Americans are indirect shareholders through 401(k)s, pensions, mutual funds, and retirement accounts.
- Ingredients: beef, buns, produce (prices fluctuate)
- Labor: wages, benefits, training
- Rent & utilities: restaurant locations
- Transportation & supply chain
- Marketing, insurance, equipment
- And yes—taxes
The final price is set to achieve a target profit margin that keeps shareholders invested and the business growing.
Now, suppose policymakers raise the corporate tax rate by 10 percentage points (or impose a new “windfall” tax). Where does the corporation get the money to pay that extra tax?
They pass it on—almost entirely—to consumers, suppliers, or workers. Corporations are not charitable entities; they are pass-through mechanisms for costs. Economic studies consistently show that when corporate taxes increase:
A significant portion (often 50–70% or more) ends up in higher prices for goods and services.
The rest may come from slightly lower wages, reduced hiring, or smaller shareholder returns (which again hits retirement accounts).
In the hamburger example: If the chain faces a meaningful corporate tax hike, they don’t just “eat” the cost—they recalibrate pricing upward. That $15 burger might become $15.50 or $16 over time as the increased tax burden flows through the system. You pay it at the register, but it’s not labeled as a “tax”—it’s hidden in the menu price.
- Customers: higher prices for goods and services
- Employees: potentially slower wage growth or fewer benefits
- Shareholders: lower returns, affecting pensions and 401(k)s
Politicians favor corporate taxes precisely because they’re less visible than direct income or sales tax hikes. A sales tax increase shows up clearly on your receipt; a corporate tax hike gets buried in everyday costs like food, streaming services, phones, and clothing.
Corporations should pay taxes, but how much?
This doesn’t mean corporations should pay zero taxes. Fair enforcement of existing rules and eliminating unjustified subsidies make sense. But the idea that we can dramatically raise corporate taxes to fund programs without it costing regular consumers and workers is a myth. The money has to come from somewhere—and it almost always comes from you.
Now you know the mechanics. Higher corporate taxes aren’t a free lunch or a magic way to stick it to “greedy companies” without consequences. Real solutions to inequality and funding public needs require transparent discussions about who actually bears the cost—often everyday people like us. Dispelling this myth empowers better decisions, whether voting, investing, or planning your own finances.
The subject of “loop holes”. There is no such thing. Corporations and individuals pay taxes based upon tax legislation after deducting what they are legally allowed to deduct. If the law allows it, why should anyone pay more taxes than they are required to. Using the term “loop hole” is confusing and leads to people believing that something illegal is happening.
Myth #5: You Need 20% Down to Buy a House—Otherwise, It’s Impossible
You need 20% down to buy a house: This is a prevalent myth from years ago when it was almost true. Every lender has its own terms. Lender A may permit a 10% down payment, lender B may permit a 5% down payment.
Then there are smaller individual lenders and people who will finance the house they are selling to you. This is one of the most damaging housing affordability myths because it keeps people waiting years when they could qualify now.
Over the years, loans have more often been guaranteed by the federal government through two agencies Freddie Mac and Fannie Mae. These quasi-government agencies buy loans from the originator; that company you worked with sells their loan to one of these agencies. As a result, there are HUD (Housing and Urban Development) programs that require only 3.5% down.
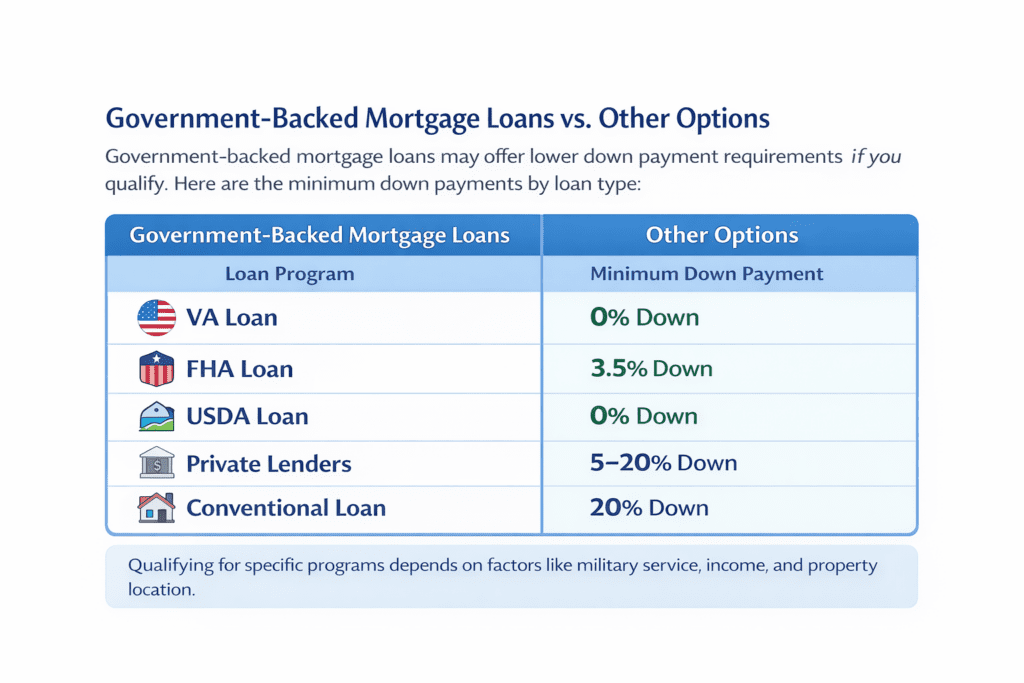
Government-Backed Mortgage Loans Often Require Little or No Down Payment
The VA has a zero-down for veterans and other agencies have zero-down with many local programs offering down payment assistance. There is absolutely no reason why you should be waiting for a 20% down payment if you can qualify for one of the government backed loans.
Of course the more you put down the lower the interest rate and the lower the monthly payment. The critical part here is having great credit for the best loan rate regardless of what program you want. If you want the “why” behind credit scoring and approvals, read: https://retirecoast.com/mystery-behind-credit-scores-mortgages/.
The debt-to-income ratio is one of the biggest obstacles, far greater than finding a lender with less than 20% down payment requirements. You need to pay off credit cards and pay down loans for vehicles also—other debt—so that the lender believes that you have sufficient free income to make mortgage payments on time. It’s time to clear up this myth now. Tools help replace housing affordability myths with facts: /calculators-hub/.
FHA loans (insured by HUD—U.S. Department of Housing and Urban Development): Require just 3.5% down for buyers with credit scores as low as 580 (or 500–579 with 10% down).
VA loans (for eligible veterans, active-duty service members, and certain survivors): 0% down, no private mortgage insurance (PMI), and competitive rates.
USDA loans (for rural and some suburban areas): 0% down for income-eligible buyers.
Conventional loans with 3% down: Available through Fannie Mae (HomeReady) or Freddie Mac (Home Possible) for first-time or lower-income buyers.
On top of that, hundreds of state and local down-payment assistance programs offer grants, forgivable loans, or matching funds—sometimes covering the entire down payment and closing costs for qualifying buyers.
Myth #6: Immigration (Especially Undocumented) Is the Main Reason Housing Is Unaffordable
This myth as with others tends to overstate the issue. Of course if there is a large number of people moving into a big metro area, they need to live somewhere and will add competition to housing. This can push up prices and create a worse shortage.
But it is not the only problem with housing affordability, it is certainly one but one among many. This is one of those housing affordability myths that can distract people from real planning.
Why this comes up is that many if not most illegal immigrants tend to concentrate in large cities where they can “blend in”. It’s common for several to live in a single house or apartment sharing living costs. This is one reason why they can “bid up” or pay more for an apartment or house.
- Pew Research Center: Record ~14 million in 2023, with modest changes since
- Migration Policy Institute: ~13.7–14 million from mid-2023 through early 2025
Massive immigration in a short period of time surrounding COVID is also an anomaly but it happened and has been added to all of the other issues which include a shortage of new construction. The issues with new construction will be discussed in another section.
A large portion of immigration in the past four years has come from large numbers of individuals permitted to live in the United States until conditions in their countries improve. This includes people from Venezuela, Somalia, Syria, Haiti and more. These people are not here illegally however they do not have permanent status either.
Effects in 2025 and Beyond
By late 2025, sharp declines in immigration (due to policy changes/deportations) began easing demand:
- Foreign-born population dropped ~1 million in early 2025 (first decline since 1960s).
- Rents stabilized or fell in immigrant-heavy pockets (e.g., southwest Houston, parts of Manhattan/Miami).
- Overall, national rents projected up ~4.8% for 2025 vs. 2024, but slower in high-immigrant metros.
In summary, the 2020–2025 immigration wave did put significant pressure on housing in big metros like New York, Miami, Los Angeles, Houston, and Chicago—worsening affordability amid limited supply. It was a contributing factor (especially for rentals), but not the sole or primary driver for the nationwide crisis. Reduced inflows in 2025 started to alleviate some strain, though the underlying shortage persists.
The Myth: “All-Cash Buyers Are Forcing Out First-Time Buyers by Offering to Pay More”
This is a common perception in tight housing markets like California, where competition is fierce and foreign/investor cash (e.g., from Chinese buyers) adds to the narrative. The idea is that cash buyers—often investors or wealthy individuals—overbid dramatically with all-cash offers, pricing out first-time buyers who rely on mortgages.
Reality: It’s largely a myth on the “paying more” part. Cash buyers have a strong advantage, but it’s not primarily because they pay higher prices. In fact, the opposite is often true.
Key Facts from Recent Data (2024–2025)
- Cash buyers actually pay less on average: A major 2024 study from UC San Diego Rady School (analyzing millions of U.S. sales) found all-cash buyers pay ~10% less than mortgage-financed buyers. Sellers accept lower cash offers for the certainty and speed—no financing contingencies, appraisals, or fall-through risk.
- In riskier markets (e.g., with more low-income financed buyers), the “cash discount” can reach up to 17%.
Stop listening to myths, get the facts
It’s important that Millennials not listen to myths such as the illegal immigrants are entirely responsible for the housing problem. And just as important that this and other fallacies are not spread around. The housing shortage has existed for a very long time and is directly attributed to poor government planning, zoning issues, cost of materials, high interest rates brought on by too much government borrowing and more.
If you are considering changing markets as part of your solution, this is a key planning article: https://retirecoast.com/selecting-where-to-relocate/. The only way to beat housing affordability myths is to look at your options and run the numbers.
Myth #7: Millennials and Gen Z Are Priced Out of Housing Forever
Millennials and Gen Z are priced out of housing: This is a pervasive myth which has no foundation. Social media spreads this myth and it gets picked up without any serious consideration for the facts. It’s one of the most repeated housing affordability myths and it creates a depressing mindset that prevents action.
Millennials are buying houses today faster than any other group. This is a fact meaning that in the markets where they are buying, they are finding homes and can afford the house they are buying. True, more could buy if the supply in tight markets were better but the evidence is that Millennials are on track to outperform other generations in home ownership already.
Some with student debt can buy a house
And, some have student loan debt yet are still able to buy a home. How did they do it? Planning, saving, great credit and jobs that generate sufficient income to be approved for a mortgage. Even more than these items is determination to succeed.
Some obtain loans from their parents. Others stop buying what they don’t need and save that 3.5% to qualify for a government backed loan. Join in dispelling this myth—look at the stats. For related millennial resources and ongoing content, visit: https://retirecoast.com/millennial-financial-hub-2026/ and https://retirecoast.com/millennial-hub/. When you move from doom-scrolling to planning, housing affordability myths lose their power.


Comparisons to previous generations reveal delays, not denial:
- Millennials reached key milestones later (e.g., homeownership at age 30 was ~33% for millennials vs. ~42–48% for Gen X/boomers at the same age).
- But as they enter mid-career (late 30s–40s), rates rise sharply—older millennials have closed much of the gap with Gen X at similar ages.
Gen Z (up to age 28) is earlier in the process, with rates ~26% for adult members, but many are tracking ahead of millennials/Gen X at comparable young ages in some metrics.
How are so many succeeding despite obstacles like student debt?
- Strategic planning: Building strong credit, paying down high-interest debt (credit cards, auto loans) to improve DTI ratios.
- Career growth: Incomes rise with experience—many qualify after 5–10 years in their field.
- Family help: Gifts or loans from parents for down payments (common for 25–30% of younger buyers).
- Lifestyle choices: Cutting non-essentials to save for low-down-payment programs (e.g., 3.5% FHA).
- Flexibility: Relocating to affordable markets or buying modest starter homes.
- Above all, determination: Those who prioritize ownership find paths—using government-backed loans, assistance programs, or waiting for the right timing.
The evidence is clear: millennials are on track to achieve (and in some cases outperform) prior generations’ eventual ownership levels as life stages align. More supply in tight markets would help even more, but the stats refute the “forever priced out” narrative.
Join in dispelling this myth—share the real data. Challenges exist, but homeownership remains achievable with focus and realistic steps.
Resources for this myth
Myth #8: There’s No Affordable Housing Left Anywhere
There is no affordable housing left. Yet another famous myth without foundation. We just discussed how Millennials are buying homes at a brisk pace. This means there are affordable homes “out there”. This is one of the housing affordability myths that survives because people confuse “expensive where I want to live” with “expensive everywhere.”
Remember that there are two sides to a transaction: income and price. You may not be able to afford a home now but as your income increases over time—and it will—you begin to overcome the not having enough money part of the equation.
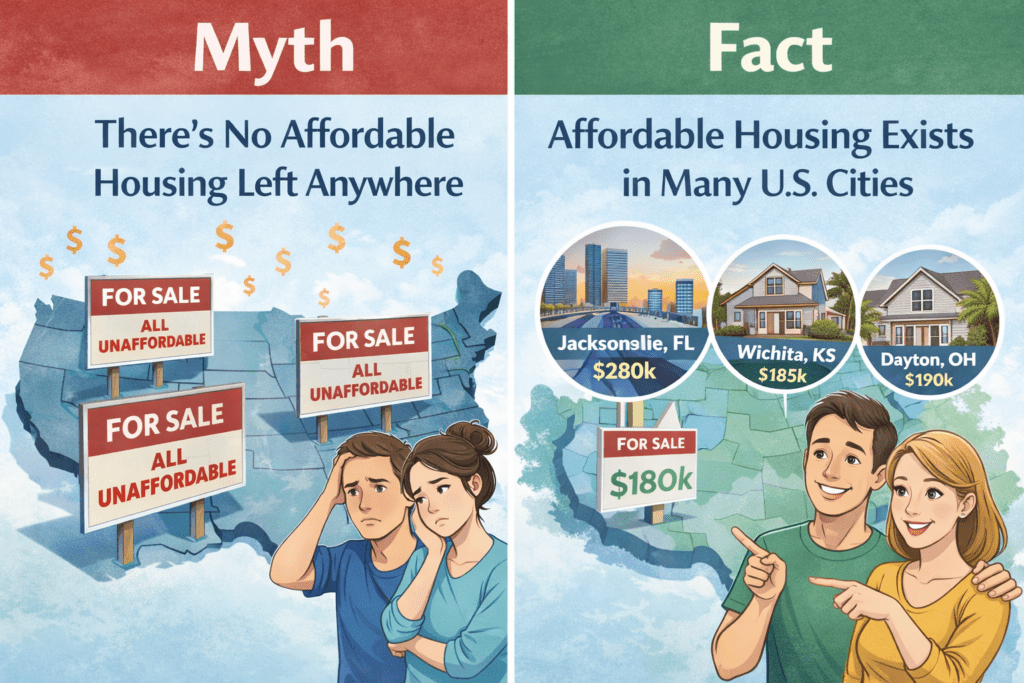
Myth vs. Fact: Affordable Housing Still Exists in Many U.S. Markets
Now price: you can try to buy where you live now or move to a more affordable area. A typical home in Southern California sells for about $750,000. A typical home on the Mississippi Gulf Coast and in many other states can sell for as low on average as $225,000.
There are many job markets which are growing now with new factories and plants actually under construction. A number of them are in small cities, even rural areas where not only is the cost of a home low but overall costs are less.
The point is there are choices and Millennials should not discount any of them without investigation. For example, housing in Los Angeles was once very unaffordable and in short supply.
People moved out to Orange County where it was much more affordable and there was supply; jobs moved out there along with amenities. When Orange County became unaffordable, people moved out to Riverside County and repeated the process.
There are lots of options. If you decide to stay where you are in a highly congested and expensive area, then affordable housing is not the issue. If relocation is on the table, use this guide: https://retirecoast.com/selecting-where-to-relocate/. Real planning is how you escape housing affordability myths.
Myth #9: Student Debt Means You’ll Never Recover Financially
Many millennials were pushed and coerced into going the college route. With almost no guidance, Millennials selected majors without considering the ROI approach. The result is that after graduation those great high paying jobs did not materialize. Broken promises from everywhere. This is one of the housing affordability myths that becomes a life story for people who stop thinking in “next steps.”
This is particularly bad if you were pushed into going to college and are not earning what you expected. To add insult to injury you may be carrying a large debt load from college. Not only are you still living with your parents because your job at the local mall does not pay a living wage but that debt is a heavy burden.
To make matters worse, your parents probably signed for the debt and they are trying to save for retirement. This is also connected to generational financial realities and the Great Wealth Transfer: https://retirecoast.com/great-wealth-transfer-baby-boomers/.
There is good news. You will not always owe that debt. Over time your income will increase but not by accident. If you take charge of your career, it may be time to move on to one that pays more.
Many millennials are moving to the trades where phenomenal salaries exist. For example as a welder building ships with an average income of $80,000-$120,000 and more if you are an underwater welder. Some become plumbers and after a few years own their own businesses. The best part: these jobs are basically AI-proof.
To get out of that student debt, you need to earn more to pay it off sooner. It’s being done every day by people your own age. If you want calculators and planning tools that support this, start here: /calculators-hub/. Taking action beats housing affordability myths every time.
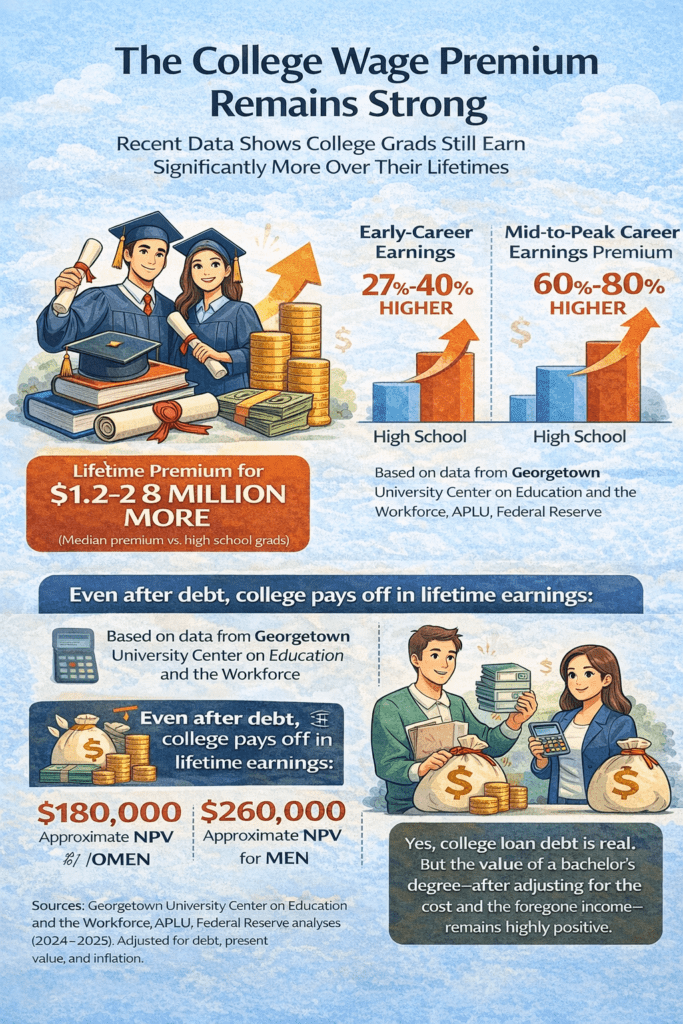
The College Wage Premium Remains Strong Over a Career
The college wage premium remains strong and grows substantially over a career. Recent data (2024–2025):
- Bachelor’s degree holders earn a median lifetime premium of $1.2–2.8 million more than high school graduates (adjusted figures from sources like Georgetown University Center on Education and the Workforce, APLU, and Federal Reserve analyses).
- Early-career premium: ~27–40% higher earnings.
- Mid-to-peak career: ~60–80% higher.
- Even after debt, the net present value of a bachelor’s is positive (~$180,000–260,000 for women/men).
Average debt levels (late 2025 estimates):
- Millennials: ~$33,000–42,000 per borrower.
- Gen Z: ~$14,000–23,000 (lower since many are recent grads).

Incomes don’t stay stagnant—they rise with experience, switches, or pivots. Many millennials and Gen Z are accelerating recovery by entering skilled trades, where demand is high, training is shorter/cheaper, and jobs are largely AI-resistant.
Examples:
- Shipbuilding welders (e.g., Gulf Coast): ~$46,000–$76,000 annually (higher in demand areas like Mississippi/Pascagoula).
- Plumbers: National average ~$63,000; experienced/master or business owners often $80,000–$100,000+.
- Underwater welders: $55,000–$100,000+ (specialized, high-risk premium).
Trends show growing shifts: Gen Z and younger millennials increasingly choose trades for stability, with reports of 40–55% considering them (up significantly in recent years).
Success stories happen daily through:
- Proactive career moves (certifications, apprenticeships).
- Aggressive debt payoff with higher earnings.
- Determination: Cutting extras, side hustles, or relocating for better opportunities.
You’re not stuck forever—many your age are paying off debt faster, buying homes, and building wealth by taking charge.
Resources for this myth
- Student Loan Repayment Calculator: Federal Student Aid Simulator – Explore plans and forgiveness.
- YouTube explainer: “How I Paid Off $XXK in Student Loans” – Search channels like Graham
Myth #10: Renting Is Always “Throwing Money Away”
A myth also with some truth. Most myths start with a small measure of truth so here is the truth part. Buying a home does build wealth. People who at the time of retirement own homes will usually do better in retirement. But this is also one of those housing affordability myths that becomes harmful when applied to everyone the same way.
Yes, you will earn equity in two ways: paying off the mortgage and the value increase through inflation and other market conditions. These are facts.
The big “but” is that owning is not for everyone. Single people often do not have the time or want to keep up with a house or even a condo. They want the flexibility to move when they want—even if it’s across the street.

Renting vs. Buying: A Common Reality for Many Millennials
Renting requires a deposit but not a big down payment or even 3.5% to get in. Some want to live in an apartment in an inner city where housing is not only not affordable but very expensive when they can get a roommate for an apartment.
Some people who buy houses do not take care of them and the value decreases. These people should not own a house; they do not want to maintain it or even in some cases know how to.
For these individuals there is no consideration about throwing money away. The bottom line is that if owning a house is for you then it can be a great investment and be financially better than renting, but it’s not for everyone. If you want to run rent vs buy scenarios and affordability numbers, use: /calculators-hub/. Replacing housing affordability myths with real math is the point of doing this work.
Myth #11: The System Is Completely Rigged—You Have No Real Chance
The system is completely rigged. The United States embraces the free market concept allowing people to set prices and buyers to choose to buy or not. If government does not intervene aside from safety considerations, the system has worked well since 1776. This myth is one of the most poisonous housing affordability myths because it convinces people they have no agency.
There have been attempts to rig various parts of the economy over the last few hundred years but they always fail in the end. This is one of the worst myths because this myth basically tells you that you have no say in the matter and that you make no real decisions.
The chart below shows that Millennials are improving their credit scores
The best way to overcome this myth is to create your own plan for everything from finances to family to property. Put yourself in charge, learn the system. If you want to anchor your plan inside a broader set of millennial resources, start here: https://retirecoast.com/millennial-financial-hub-2026/ and https://retirecoast.com/millennial-hub/.
For example, there is a system to buy a house. That system involves a credit check. You can beat the system if you avoid long term debts, pay your obligations on time every time and a few other details. Mastering this system means you will qualify to buy a house.
It’s called using the system to your advantage. The system at work requires you to show up at 8:00. If you want a deep dive into how credit scoring really works in mortgages, read: https://retirecoast.com/mystery-behind-credit-scores-mortgages/. People who learn the rules stop believing housing affordability myths and start building results.
What is the real problem with housing? Not the myth
- Early millennials (now in their late 30s to mid-40s) led a “back-to-the-city” movement in the 2000s–2010s, revitalizing urban cores.
- By the 2020s, many have suburbanized, driven by high urban costs, remote/hybrid work, and life changes like marriage/kids.
- Harvard’s Joint Center for Housing Studies (2024 analysis) found early millennials gained most in peripheral suburban areas between 2011–2021, often due to lack of affordable family-sized urban housing—mirroring Gen X and late boomers.
- Migration patterns — Millennials are moving to affordable metros in the South/Midwest (e.g., Jacksonville FL, Baltimore, Wichita) with lower home prices (~$180k–$300k vs. national ~$400k+). High-cost coastal cities see outflows.
- Willingness to compromise — Surveys show increasing acceptance of smaller/older homes or relocation; only ~38% of millennial buyers are open to moving for affordability (vs. 41% Gen Z), but this rises with age/family needs.
- Homeownership catch-up — Millennial rates lag prior generations at younger ages (e.g., ~51–55% overall in 2025, vs. higher for boomers/Gen X at the same age), but climb steadily into mid-career as incomes grow and priorities shift toward equity-building.
- Family formation → More millennials are marrying/having kids later; drivers include desire for space, pets, and good schools—pushing toward suburbs (e.g., family-friendly communities with outdoor access).
- Affordability pressure → Perpetual high rents/prices in preferred cities make staying unsustainable; many realize long-term wealth comes from ownership in reachable markets.
- Remote work persistence → Reduces ties to expensive job hubs, enabling moves to places like the Gulf Coast or inland South without career sacrifice.
Take the Housing Myths Quiz
Take the Housing Myths Quiz (10 Questions)
Instant feedback + your score + next-step links.
OPEN
Conclusion: Break Free from the Myths and Build Your Future
You’ve now seen the truth behind the 11 most persistent financial myths that hold millennials and Gen Z back—from corporate home-buying conspiracies to the idea that the entire system is rigged against you. These stories feel compelling because they tap into real frustrations: high prices, student debt, wage gaps, and a world that sometimes seems unfair.
But myths thrive on oversimplification, and clinging to them keeps you stuck—blaming invisible villains while overlooking the practical steps that thousands in your generation are already taking to succeed.

Busting Housing Myths with Facts, Not Fear
The facts are empowering: rates are normal, low-down-payment programs exist, affordable homes are available in hundreds of markets, incomes grow with experience, and the system—flawed but stable—rewards those who learn its rules and take consistent action.
Homeownership rates are rising for millennials, debt is being paid off faster than ever, and wealth is being built every day by people who refuse to accept defeatist narratives.
You are not powerless. You have choices—where to live, what to study or train for, how to manage debt and credit, when to buy or rent, and how to invest your time and money. The path to financial independence isn’t handed out; it’s built through informed decisions, flexibility, and determination.
Call to Action: Take Control Today
Pick one myth that resonates most with you and run the numbers using the calculators linked in this article (mortgage qualifier, rent-vs-buy, cost-of-living comparison, student loan simulator). Start here: /calculators-hub/.
Build or update your plan—set a 6-month goal for credit improvement, debt payoff, or savings toward a down payment.
Explore a new market—spend 30 minutes researching one affordable area with growing jobs (like the Gulf Coast, Carolinas, or Midwest hubs). Use: https://retirecoast.com/selecting-where-to-relocate/.
Share this article—send it to a friend who’s stuck in the same myths. Breaking the cycle starts with better information.
Subscribe or follow for more no-nonsense guidance on navigating housing, debt, careers, and wealth-building in 2026 and beyond. For more Millennial-focused resources, visit:
https://retirecoast.com/millennial-financial-hub-2026/
https://retirecoast.com/millennial-hub/
Want more references? Try these to confirm what has been presented above:
-
National Association of Realtors (NAR) – Research & Statistics
https://www.nar.realtor/research-and-statistics
Official source for housing market data, reports, and metro-level statistics. -
U.S. Department of Housing and Urban Development (HUD) – Data Sets
https://www.huduser.gov/portal/pdrdatas_landing.html
Comprehensive datasets on housing stock, affordability, and programs like FHA loans. -
HUD Open Data Portal
https://data.hud.gov/
Access to HUD’s open datasets on housing, community development, and affordability. -
Freddie Mac – Primary Mortgage Market Survey (PMMS)
https://www.freddiemac.com/pmms
Historical and current mortgage rate data since 1971. -
Freddie Mac – PMMS Archive
https://www.freddiemac.com/pmms/pmms_archives
Full historical mortgage rate archives. -
Harvard Joint Center for Housing Studies
https://www.jchs.harvard.edu/
Annual “State of the Nation’s Housing” reports and affordability research. -
U.S. Census Bureau – Housing Vacancy Survey (Homeownership Rates)
https://www.census.gov/housing/hvs/index.html
Quarterly homeownership rates, including by age/generation. -
Federal Reserve Bank of New York – Student Debt Data
https://www.newyorkfed.org/microeconomics/topics/student-debt
Interactive student loan debt statistics and trends. -
Federal Reserve Board – Economic Well-Being Report (Student Loans Section)
https://www.federalreserve.gov/publications/2025-economic-well-being-of-us-households-in-2024-higher-education-and-student-loans.htm
Latest SHED report section on education debt. -
Bureau of Labor Statistics (BLS) – Earnings & Unemployment by Educational Attainment
https://www.bls.gov/emp/chart-unemployment-earnings-education.htm
Wage premium and unemployment data by education level. -
Urban Institute – Housing Finance Policy Center
https://www.urban.org/expertise/housing-finance
Independent research on housing finance, affordability, and policy. -
Fannie Mae – National Housing Survey
https://www.fanniemae.com/data-and-insights/surveys-indices/national-housing-survey
Home Purchase Sentiment Index and consumer housing attitudes. -
Pew Research Center – Housing Affordability Facts
Key facts about housing affordability in the U.S.
Key data on affordability trends and demographics. -
Migration Policy Institute – Research on Immigration & Housing
https://www.migrationpolicy.org/article/housing-crisis-immigrants-integration
Analysis of immigration’s role in housing markets.
FAQ – Frequently Asked Questions about Housing Affordability
1) Does BlackRock own single-family homes?
2) Are institutional buyers still “buying everything” in 2025?
3) Why do mortgage rates feel “high” even when they’re normal?
4) Should I wait for rates to drop below 4% before buying?
5) Is CEO pay a major cause of housing prices or affordability?
6) If corporate taxes go up, who really pays?
7) Do I really need 20% down to buy a home?
8) What matters most to qualify for a mortgage?
9) Is immigration the main cause of housing unaffordability?
10) Are Millennials and Gen Z actually buying homes today?
11) Is there truly “no affordable housing left anywhere”?
12) Does student debt automatically prevent homeownership?
13) Is renting always “throwing money away”?
14) What is one practical first step to “beat the system”?
15) What should I do next after reading this article?
Discover more from RetireCoast.com
Subscribe to get the latest posts sent to your email.


