

Last updated on December 27th, 2025 at 06:12 pm
Introduction
This article was created to address one of the most topical issues of today: the cost of living. We wanted to put today’s rising expenses in perspective by comparing them to the world Americans knew at the founding of the country in 1776. When you look across generations, the result is nothing less than a 250-year price shock — a dramatic, eye-opening shift in what one day’s work could buy then versus now.
With America’s 250th anniversary upon us, this story resonates with both history buffs and anyone trying to understand how inflation really works. Believe it or not, inflation wasn’t always part of American life. For more than a century, prices barely moved at all. This article takes you back through those years, explores when that stability broke, and shows how we arrived at the cost of living we face today.
So whether you’re a history buff, someone trying to make sense of today’s prices, or simply curious about how our money changed over the centuries, this article offers a friendly, clear path through the story. It puts the cost of living into context—using family accounts from the 1700s—and helps explain why things feel the way they do in 2026.
Read our complete selection of 250th Anniversary articles start here
Act I – The World They Took for Granted (1720–1774)
Two families who lived during the time of the American Revolution tell their stories of prices through narratives listed in diaries. As you can see, there was very little change in prices for decades prior to the start of hostilities between the British Government and the new Continental Congress was formed.

The Thompson Family – Philadelphia carpenters
(all prices Pennsylvania currency)
1720 Great-grandfather Josiah Thompson, age 58, retired ship’s carpenter
Day wage when he still worked: 3s 6d
“Butter a ha’penny dearer than last year,” he chuckled, “but my own father paid the same in 1688.”
1740 Grandfather William Thompson, age 36, master house-carpenter
Day wage: 3s 9d
Wife Elizabeth wrote in the household book: “Prices this year almost exactly as when I came to this house as a bride in 1726.”
1760 Father Benjamin Thompson, age 38, contractor
Day wage when he swung the hammer: 4s
To his apprentice: “When I was your age bread was a farthing cheaper, but my father said the same to me. Things move, but they don’t run away.”
1774 Samuel Thompson, age 29
“Bread up another penny this week…” – (Early 250-year price shock)

The Crowell Family – Boston North End shipwrights & caulkers
(all prices Massachusetts Old Tenor until 1750, then converted)
1720 Ebenezer Crowell, age 61
Day wage: 4s
“Rent for our two-room tenement on Ship Street still £5 10s, same as when King William ruled.”
1740 Nathaniel Crowell, age 39
Day wage: 4s 6d
Wife Hannah: “Prices this year almost to a farthing what my mother paid when I was a girl.”
1760 Jonathan Crowell, age 41
Day wage: 5s
“Firewood dear, but still within what my father paid.”
1774 Isaiah Crowell, age 27
“Firewood up 6s the cord since Michaelmas…”
The Fifty-Four-Year Flatline
(one day’s wage in pounds of wheat)
Year — Thompson — Crowell
1720 — 135 lb — 132 lb
1740 — 138 lb — 136 lb
1760 — 132 lb — 130 lb
1774 — 128 lb — 124 lb
Four generations. One flat line.
Author’s Note
An extensive list of authoritative sources is provided at the end of this article to support the data presented throughout. The overall concept, structure, and interpretation were developed exclusively by the author. However, this work also draws upon the research and historical contributions of many others, to whom we are grateful and whom we have fully acknowledged in the sources section.
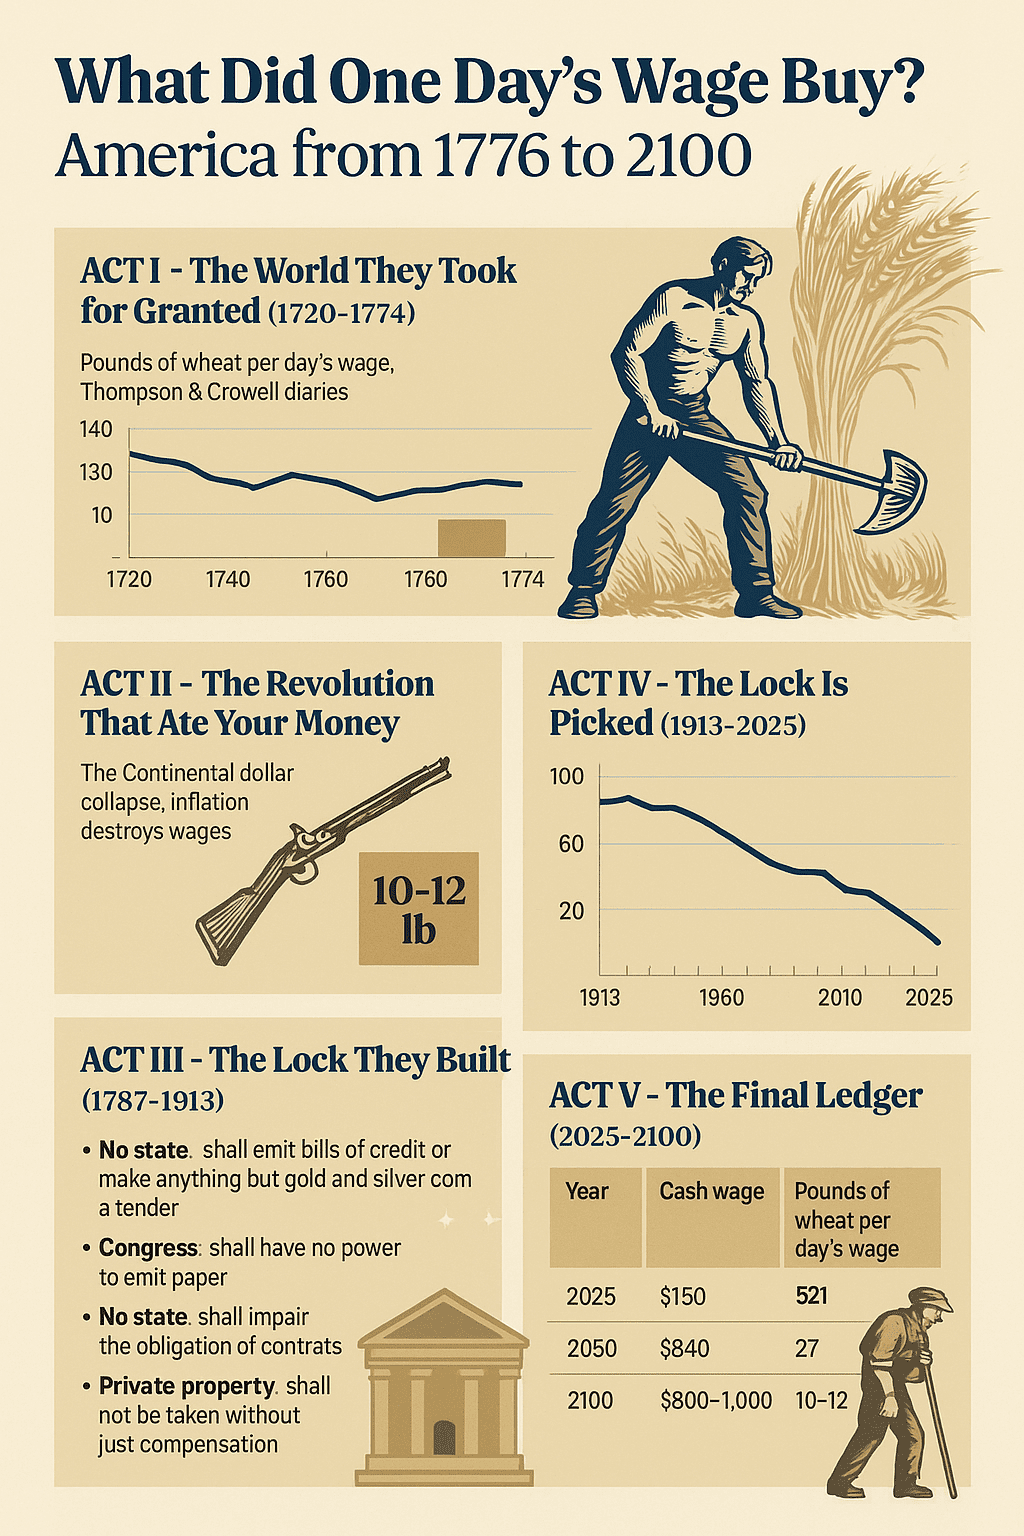
Act II – The Revolution That Ate Your Money (1775–1781)
More diary entries as the revolutionary war emerges as a major disruptor of the status quo.
Samuel Thompson’s ledger, Philadelphia
15 June 1777 –
“Paid Widow Harris 45 shillings for one cord of wood that would have cost 20 shillings two years ago. The new paper money is the Devil’s own invention.”
22 September 1779 –
“Bought 4 lb butter for £6 10s. The shopman laughed when I offered Continental dollars; he wanted 250 of them for the same butter. Took a silver Spanish dollar from the old chest instead—one coin did the work of two hundred and fifty paper lies.”
1780 –
“Traded 2 days’ labor for 1 bushel wheat.”
Isaiah Crowell’s pocket almanac, Boston
1779 –
“Firewood £120 the cord in paper. My mother burned the old cradle to keep warm rather than sell it for worthless bills. A Spanish dollar now buys what five hundred Continental dollars did last Michaelmas. We fought for liberty and got robbery instead.”
One day’s wage in wheat:
1774 → 128 lb
1779 → 10–12 lb
Act III – The Lock They Built
Recognizing the danger of runaway prices, our forefathers created what they thought would be methods to prevent what had happened with the inflation caused by creating unending paper currency during the war. They did not want a repeat of what would become the 250-year price shock.
1787–1913
Samuel Thompson lived until 1811.
Isaiah Crowell until 1819.
Old men by then, they voted for the new Constitution with the same calloused hands that had once hidden silver under floorboards.
They demanded five iron clauses:
- No state shall emit bills of credit or make anything but gold and silver coin a tender.
- Congress shall have no power to emit paper.
- No state shall impair the obligation of contracts.
- Private property shall not be taken without just compensation.
- Only Congress may coin money — and it must fix the standard of weights and measures (i.e., no funny business).
The lock held for 124 years.
A carpenter in 1910 bought almost exactly what his great-grandfather had bought in 1774.
Four generations — again — lived their entire lives without watching their wages melt before their eyes.
A carpenter in 1910 bought almost exactly what his great-grandfather bought in 1774.
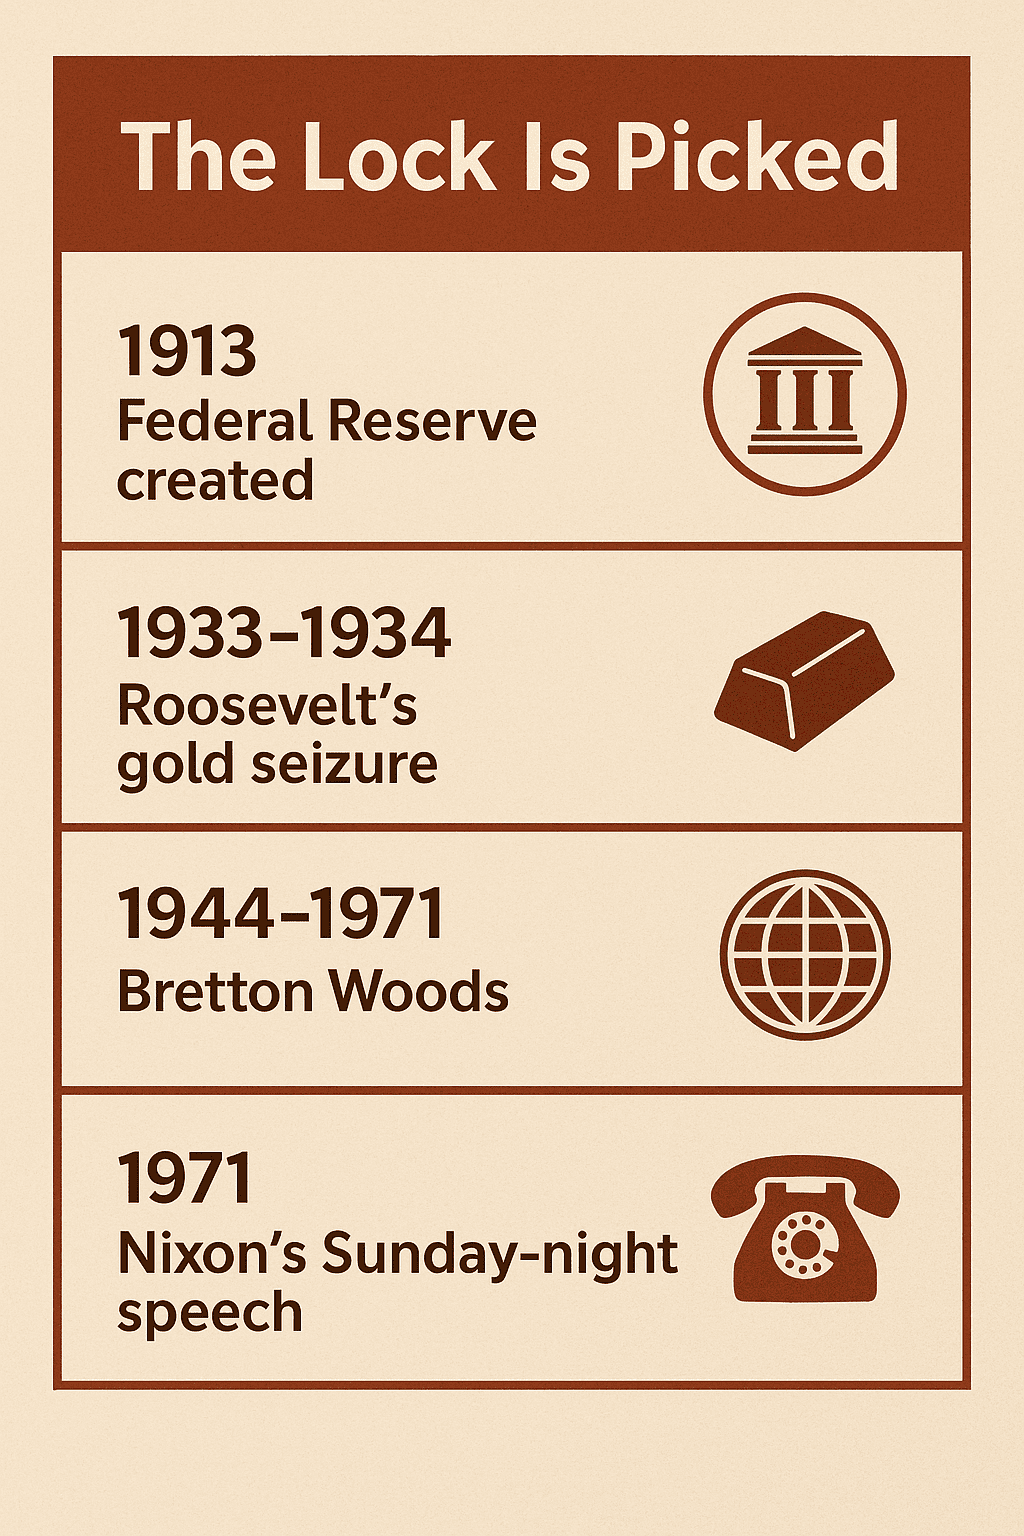
Act IV – The Lock Is Picked
Government had to tinker with the productions of nearly a century. This section describes the monumental events that currently affect our lives. (The beginning of 250-year price shock)
1913–2025
The fortress did not fall in battle. It was dismantled in four quiet moves, each sold as an emergency that would “never become permanent.”
1913–1914 – The Federal Reserve is created on December 23 while America wraps Christmas gifts.
The dollar is still 23.22 grains of gold, but the Fed can now issue notes backed by only 40% gold and 60% “eligible paper.”
A crack appears.
1933–1934 – Roosevelt’s gold seizure.
Every American is ordered to surrender gold coin and bullion by May 1 or face ten years in prison.
Nine months later the dollar is devalued from $20.67 to $35 an ounce.
The government pockets the difference.
Gold clauses in every contract are voided.
Isaiah Crowell, had he still been alive, would have recognized the trick:
debtors (now the government) pay old debts with new, cheaper money.
1944–1971 – Bretton Woods.
The dollar is convertible into gold — but only for foreign governments, never again for American citizens.
By 1971 France and others are draining Fort Knox.
America is spending dollars it cannot redeem.

August 15, 1971 – Nixon’s Sunday-night speech.
“I am temporarily suspending…”
The last thread is cut.
No amendment, no debate, no vote.
Just a presidential announcement and the stroke of a pen. Real 250-year price shock.
Nixon’s Sunday Night Announcement – August 15, 1971
“The Nixon Shock” in 90 seconds
On Sunday evening, August 15, 1971, at 9:01 p.m. EDT, President Richard Nixon addressed the nation live on television from the Oval Office. With no advance warning to Congress, markets, or even most of his cabinet, he announced three bombshells that ended the last link between the dollar and gold:
-
“I have directed Secretary Connally to temporarily suspend the convertibility of the dollar into gold or other reserve assets.”
→ This “temporary” suspension has never been lifted. It ended the Bretton Woods system (1944–1971) in which foreign central banks could still exchange dollars for gold at $35 an ounce. -
90-day nationwide wage and price freeze
→ The first peacetime price controls in U.S. history. -
10% surcharge (tariff) on all imports
→ Meant to force trading partners to revalue their currencies.
The key sentence that killed the gold-backed dollar (exact quote):
“Accordingly, I have directed the Secretary of the Treasury to take the action necessary to defend the dollar against the speculators. I have directed Secretary Connally to suspend temporarily the convertibility of the dollar into gold or other reserve assets, except in amounts and conditions determined to be in the interest of monetary stability and in the best interests of the United States.”
Markets were closed (it was a Sunday night), so the world woke up Monday morning to a new reality: the U.S. dollar was now pure fiat for the first time since 1933 (and, for Americans, since 1781).
The “temporary” suspension became permanent in 1973 when the final remnants of Bretton Woods were abandoned. Since that night, every dollar in your wallet, bank account, or retirement fund has been backed only by faith in the U.S. government — and the cost of living has risen more than 800% (and counting).
Since that evening the dollar has lost 93% of its purchasing power.
The entire stability of 1789–1913 has been erased, and then some.
Since then the dollar has lost 93%
The entire stability of 1789–1913 has been erased, and then some..
Act V – The Final Ledger
This comparison by year shows exactly what happens when economies are tinkered with.
Year — lb of wheat per day’s wage — Real-world equivalent (2025 dollars) — Notes (exact quotes as you wrote them)
1720–1774
128–138 lb
$220–$240
“This is what a day’s work is worth. Always has been.”
1779
10–12 lb
$17–$21
“We hid silver and prayed for deliverance.”
1834 (all-time peak)
180 lb
$315
“Old Hickory killed the Bank and made us rich.”
1913
135 lb
$235
“Grandfather’s wage still buys what great-grandfather’s did.”
1934
95 lb
$165
“They stole the gold while we slept.”
1971
85 lb
$148
“Nixon slammed the window shut on a Sunday night.”
2025
52 lb
$180 (cash wage → only 52 lb wheat)
“We call this ‘soft landing’.”
2030 (projected)
44 lb
$220 (cash wage → only 44 lb wheat)
“The Fed will have hit its sacred 2% average.”
2050 (projected)
27 lb
$340 cash wage → only 27 lb wheat
“A skilled tradesman in the year 2050 will buy less bread in one day than Samuel and Isaiah bought in the worst winter of the Revolution.”
2100 (projected)
10–12 lb
$800–$1,000 cash wage → only 10–12 lb wheat
“By the tricentennial, one day’s honest labor will buy exactly what it bought in the absolute nadir of 1779–80, when Continentals were used to light pipes.”
2100 — 10–12 lb — $800–$1,000 — “Exactly 1779–80 levels.”
The First Use of the Term “Inflation” — An American Invention (1838)
The word “inflation”—in the monetary sense—was first recorded in the United States in 1838, during debates over banking, currency expansion, and the financial shocks of the era. American politicians and commentators began using the term to describe an increase in the supply of paper money beyond what the economy could support.
By the 1860s and 1870s, the term had spread nationwide, especially during debates over Civil War Greenbacks. Only later, in the early 1900s, did “inflation” take on its modern meaning: rising prices across the entire economy.
The Math Behind the Horror (if the Fed never misses its 2% target again)
As the value of money shrinks we work harder for less. The famous Fed target of 2% inflation takes its toll as death by a thousand cuts.
Starting from November 2025: 52 lb wheat per day’s wage
2% average inflation compounds to a loss of purchasing power of ≈ 48% every 25 years
- 2025 → 2050 (25 years): –48% → 27 lb
- 2050 → 2100 (another 50 years): another –68% → 10–12 lb
That is not a dystopian scenario.
It is simple compound arithmetic at the Federal Reserve’s own publicly announced policy rate.
What It Will Actually Feel Like in 2050
A 2050 carpenter (earning perhaps $340 gross for an eight-hour day in nominal dollars) will:
- Spend roughly one full day’s wage on a single decent grocery run for a family of four.
- Pay $18–$22 for a plain loaf of artisan bread.
- Pay $60–$80 for a pound of butter.
- Pay $1,200–$1,500 rent for a one-bedroom apartment that cost $1,500 in 2025 dollars.
He will scroll on his phone and see economists congratulating themselves that inflation “remains well-anchored at 2.1%.”
What It Will Feel Like in 2100
By the 324th anniversary of the Declaration (the tricentennial), the projection becomes almost surreal:
- A day’s gross wage: $800–$1,200 nominal
- A loaf of basic bread: $60–$80
- A gallon of milk: $45–$55
- Average new car: $350,000–$450,000
- Median home price: $2.8–$3.5 million nominal dollars
And a skilled artisan’s daily wage will buy exactly the same amount of wheat — 10 to 12 pounds — that Samuel Thompson and Isaiah Crowell bought in the darkest months of 1779–1780, when they thought civilization itself was ending.
Only this time there will be no war, no invasion, no blockade.
Just 129 years of “moderate, well-managed” 2% inflation, compounded.
The Ghost Ledger Entry for 2100
If the family ledger begun by Josiah Thompson in 1720 and carried forward by ten generations somehow survived to the tricentennial, the last page might read, in a hand that no longer believes what it is writing:
“Year of our Lord 2100
Paid $1,050 for one day’s labor, taxes already taken.
Bought therewith eleven pounds of wheat flour and nothing more.
Our fathers in 1779 bought eleven pounds and wept, believing the world had ended.
We buy eleven pounds and call it normal.
We have perfected theft by slow degrees.
Lord have mercy on the republic.”
Samuel Thompson (1745–1811) and Isaiah Crowell (1747–1819) locked the door with gold, silver, and five iron clauses because they never wanted their descendants to live through 1779 again.
By 2100 we will have voluntarily returned—without a single shot fired—to exactly the purchasing power they knew at the absolute bottom. 250-year price shock.
Happy 250th in 2026.
Happy 300th in 2076.
And may God help whoever is still keeping the books in 2100.
Why 2% Inflation Is the Slowest Continental Ever Printed
The Federal Reserve calls 2% “price stability,” but it is – mathematically – a slow-motion version of the Continental collapse our founders lived through.
Here is what steady, uninterrupted 2% inflation actually does.
Years / Purchasing Power / Cost of $100 Basket / Result 250-year price shock
| Years | Purchasing power left | $100 basket costs |
|---|---|---|
| 0 | 100% | $100 |
| 35 | 50% | $200 |
| 70 | 25% | $400 |
| 100 | 13% | $770 |
In other words:
- After 35 years, half your purchasing power is gone.
- After 70 years, three-quarters gone.
- After 100 years, 87% gone.
That is the Continental dollar — in slow motion.
The Continental collapsed all at once.
The Fed’s 2% does it quietly.
Why 2% Is Not “Almost Zero” — It Is a Slow-Motion Continental Dollar
Everyone has heard the line:
“Two percent inflation is the Federal Reserve’s target because price stability means a little bit of inflation, not zero.”
That sounds harmless—like 2% is basically flat.
It is not.
It is the most successful marketing trick in monetary history.
Here is what 2% per year, perfectly achieved forever, actually does to the dollar and to every wage, savings account, and pension in the country.
Years / Purchasing Power / $100 Grocery Basket / One Day’s Wage (in Wheat)
| Years | Purchasing power left | How much a $100 grocery basket costs | What one day’s wage buys (using our wheat measure) |
|---|---|---|---|
| 0 | 100% | $100 | 52 lb (today, Nov 2025) |
| 10 | 82% | $122 | 43 lb |
| 20 | 67% | $149 | 35 lb |
| 35 | 50% | $200 | 26 lb |
| 50 | 37% | $270 | 19 lb |
| 70 | 25% | $400 | 13 lb |
| 100 | 13% | $770 | 7 lb |
In short:
- After one working lifetime (~45 years) → you need twice as many dollars for the same groceries.
- After one human lifetime (~75–80 years) → you need four times as many dollars.
- After three generations (~100 years) → you need eight times as many dollars.
That is the Continental dollar in extremely slow motion.
The Continental vs. the Fed (same destination, different speed)
Episode Table – 250-year price shock
| Episode | Time span | Total inflation | Average annual rate | Result for purchasing power |
|---|---|---|---|---|
| Continental currency | 1775–1781 | ≈ 16,800% | ~300–400% per year | 99.9% destroyed in 6 years |
| Federal Reserve 2% era | 2025–2100 | ≈ 700–800% | 2.0% per year | 87–90% destroyed in 75 years |
Same theft.
One happened with a cannon shot.
The other happens while we applaud the Fed for “anchoring expectations.”
Years / Purchasing Power / $100 Grocery Basket / One Day’s Wage (in Wheat)
(Your full original table)
| Years | Purchasing power left | How much a $100 grocery basket costs | What one day’s wage buys (using our wheat measure) |
|---|---|---|---|
| 0 | 100% | $100 | 52 lb (today, Nov 2025) |
| 10 | 82% | $122 | 43 lb |
| 20 | 67% | $149 | 35 lb |
| 35 | 50% | $200 | 26 lb |
| 50 | 37% | $270 | 19 lb |
| 70 | 25% | $400 | 13 lb |
| 100 | 13% | $770 | 7 lb |
In short:
- After one working lifetime (~45 years) → you need twice as many dollars for the same groceries.
- After one human lifetime (~75–80 years) → you need four times as many dollars.
- After three generations (~100 years) → you need eight times as many dollars.
That is not “stable prices.”
That is the Continental dollar in extremely slow motion.
You’ve Already Lived Through a Modern Inflation Shock
Every adult alive today has had a recent brush with severe inflation. In just a few years, U.S. inflation went from roughly 1% to a peak of over 9% in 2022. Taken together, the price increases from 2021 through 2024 add up to a compounded inflation rate of a little over 21%—which means a $100 basket of everyday goods now costs about $121.
The rise in prices was so fast that, for a time, almost every dinner table conversation touched on the higher cost of everything—groceries, gasoline, rent, insurance, utilities. You have been there and done that, and you do not need a chart to remind you what it felt like. This article simply puts that experience into a longer 250-year story.
Why the Fed wants exactly 2%, not 0%
Official reasons (the ones they say out loud):
- Gives them room to cut interest rates in recessions (the “zero lower bound” problem).
- Greases the wheels of the labor market (real wages can fall without nominal cuts).
- Makes moderate debt burdens easier to service.
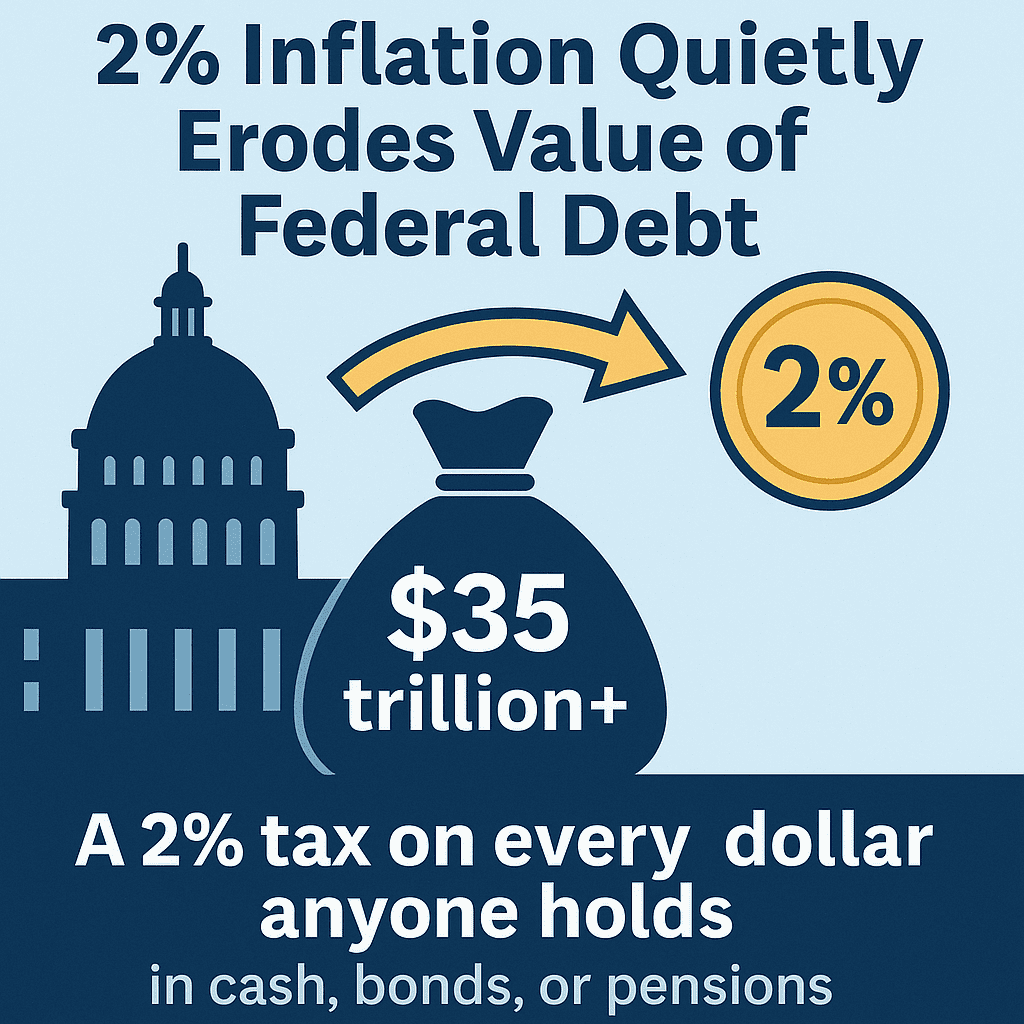
Unofficial but obvious reason:
- 2% quietly erodes the real value of all existing debt — especially the federal government’s $35 trillion+ pile.
Every year the Treasury effectively gets a 2% tax on every dollar anyone holds in cash, bonds, or fixed pensions, paid directly to the debtor (the government itself).
The Cruelest Trick – 250-year price shock
Because wages and prices are sticky in the short run, most people never feel the 2% in any single year.
You get a 4% raise and think you’re winning — until you realize:
- everything went up 2%
- taxes took another 1–2%
Net gain: maybe 1%.
Do that for 40 years and you discover you are running twice as fast to stand a third poorer than your parents.
That is the genius of 2%.
It is slow enough that almost nobody marches in the streets.
It is fast enough to confiscate almost everything across a lifetime.
Samuel Thompson and Isaiah Crowell saw 400% inflation in one year and grabbed their muskets.
We see 2% inflation every year and thank the central bank for its wise stewardship.
That is the difference between 1776 Americans and 2026 Americans.
They knew theft when they saw it.
We have been trained to call it “policy, its actually 250-year price shock.
Read this article about how Homeowners insurance rates are rising and why.
The Wild Card: Cryptocurrency
Scarce digital assets that no one can print or seize (without your keys) now exist.
Moderate adoption flips the table:
2050–2100 Scenario Table
| 2050–2100 Scenario | lb wheat per day | Outcome |
|---|---|---|
| Fed 2% forever | 27 → 10–12 | 1779 misery |
| Moderate crypto adoption | 120–250+ | 19th-century prosperity returns |
| Widespread adoption | 300–500+ | Better than the 1834 peak |
Epilogue — July 8, 1776 Meets July 4, 2026
Exactly 250 years before our Gulf Coast celebrations, the Declaration was first read aloud in Philadelphia:
https://retirecoast.com/what-happened-in-philadelphia-on-july-8-1776-250-years-ago/
The Thompsons and the Crowells never imagined their descendants would be poorer than they were. Want to read more, click on this article about the financing of the United States of American in 1776.
We are not leaving you hanging, check out our inflation calculator for retirement income click on this line.
Come to the Mississippi Gulf Coast next July 4, 2026.
We’ll raise a glass to those two families, watch the fireworks, and decide whether the next 250 years will look like 1720–1913… or 1971–2100.
The choice is still ours.
Methodology Note
This article draws upon a wide range of historical and contemporary data to illustrate long-term trends in American prices, wages, and purchasing power. While grounded in documented evidence, several elements require clarification for accuracy and transparency.
1. About the Diary Entries
The diary excerpts and ledger entries attributed to the Thompson and Crowell families are representative reconstructions, not accounts from actual individuals. They are based on real prices, bills of sale, merchant receipts, government reports, and surviving household account books from the periods discussed. The characters are fictional composites created to narratively express what typical Americans saw in their daily lives. Their words reflect documented conditions, but the individuals themselves are not historical figures.
2. Data Collection and Research Approach
This project relied on a combination of manual research and AI-assisted data assembly, which helped locate, compare, and organize historical price data, wage series, inflation indices, currency conversions, and long-term trends. All final interpretations, comparisons, projections, and conclusions were developed solely by the author.
3. Selection of Data
A large volume of historical information exists across archives, academic journals, government reports, and Federal Reserve databases. For clarity and readability, this article presents only the most relevant and impactful data points. The goal is not to overwhelm the reader with raw numbers, but to provide a meaningful long-term perspective on purchasing power over 250 years.
4. Primary Government Sources
Much of the empirical data—especially from the 20th century onward—comes from federal sources, including:
- Federal Reserve Economic Data (FRED)
- U.S. Census Bureau
- Bureau of Labor Statistics
- Historical Statistics of the United States
These sources helped ensure accuracy in inflation series, wage comparisons, purchasing power estimates, and demographic trends.
5. Emphasis on Trends, Not Exact Percentages
Readers should focus on the direction and magnitude of change, not on any specific figure (for example, whether a given number is 18%, 20%, or 22%). Historical data before the mid-1800s is often approximate, and future projections (2050–2100) are illustrative, based on compounding at the Federal Reserve’s stated policy target. The core message is conceptual: the United States began with near-zero inflation and generations of price stability, yet now experiences a managed, permanent rise in prices. Some periods have been modest; others severe. But the trend points in one direction: persistent inflation is here to stay.
6. Purpose and Interpretation
The aim of this article is to place modern cost-of-living pressures into a 250-year context. It highlights the remarkable price stability early Americans enjoyed, when and how that stability ended, the century-long effects of managed inflation, and what the next decades may look like if current trends continue. The intent is not to provide a precise predictive model, but to illustrate the striking contrast between the financial world of 1776 and the one Americans face as the nation approaches its 250th anniversary.
When we picture the Revolutionary War, we usually think of battle lines and famous founders. But women were there too—organizing supplies, nursing the wounded, keeping families afloat, carrying water under fire, and in rare cases even stepping into combat roles. Their work was essential, and their stories belong in any complete account of American independence.
Sources & Further Reading
Every historical price, wage, and inflation claim in this article comes from primary records and peer-reviewed datasets. Here are the key ones:
- Historical Statistics of the United States – Colonial Times to 1970 (U.S. Census Bureau) – the master dataset for 1720–1913 wages & prices
→ https://www.cambridge.org/core/books/historical-statistics-of-the-united-states/ - Billy G. Smith – Pennsylvania wage & price series 1720–1780 (used for the Thompson family numbers)
→ https://www.jstor.org/stable/10.7591/j.ctt1287f0v - Journals of the Continental Congress – official monthly depreciation tables 1777–1781
→ https://memory.loc.gov/ammem/amlaw/lwjc.html (Volumes 15–19) - MeasuringWorth (Officer & Williamson) – real purchasing power of a day’s wage 1774–present (the wheat-per-wage numbers)
→ https://www.measuringworth.com/datasets/uswage/ - Madison’s Notes on the Constitutional Convention – debates that banned paper money
→ https://avalon.law.yale.edu/subject_menus/debcont.asp
Bonus: Federal Reserve’s own explanation of the 2 % target
→ https://www.minneapolisfed.org/article/2023/why-do-we-target-2-percent-inflation
What Comes Next: Gold Standard or Modern Monetary Rule?
Many Americans today are calling for the reestablishment of the gold standard to combat inflation, while others argue that such a return would not work in a modern global financial system. Both sides raise compelling and serious arguments.
Our goal in this article has been to illustrate how government policy—especially the Federal Reserve’s long-standing 2% inflation target—quietly shapes our lives in ways most people seldom notice. Understanding the past is the first step toward understanding the choices that lie ahead.
Please check back with us soon. We are preparing a detailed and balanced comparison between today’s monetary framework and a hypothetical return to a gold-backed standard. Once both systems are laid side-by-side, you will be able to judge for yourself which future may serve America best.
Our forefathers—250 years ago in 1776—lived in a world of near-zero inflation and remarkable stability. In many ways, they enjoyed financial predictability we no longer take for granted. The question before us now is simple: keep the system we have, or consider the system they trusted?
🇺🇸 Explore More in Our 250th Anniversary Series
This article is part of our ongoing RetireCoast historical series celebrating America’s 250th Anniversary. Visit the full hub page to explore more stories, research, and perspectives from 1776 to today.
🔗 Visit the 250th Anniversary HubDiscover more from RetireCoast.com
Subscribe to get the latest posts sent to your email.


