

Every night, while you sleep, the United States spends tens of millions of dollars — not on services, not on infrastructure, not on you — but just on interest. What is the national debt interest impact?
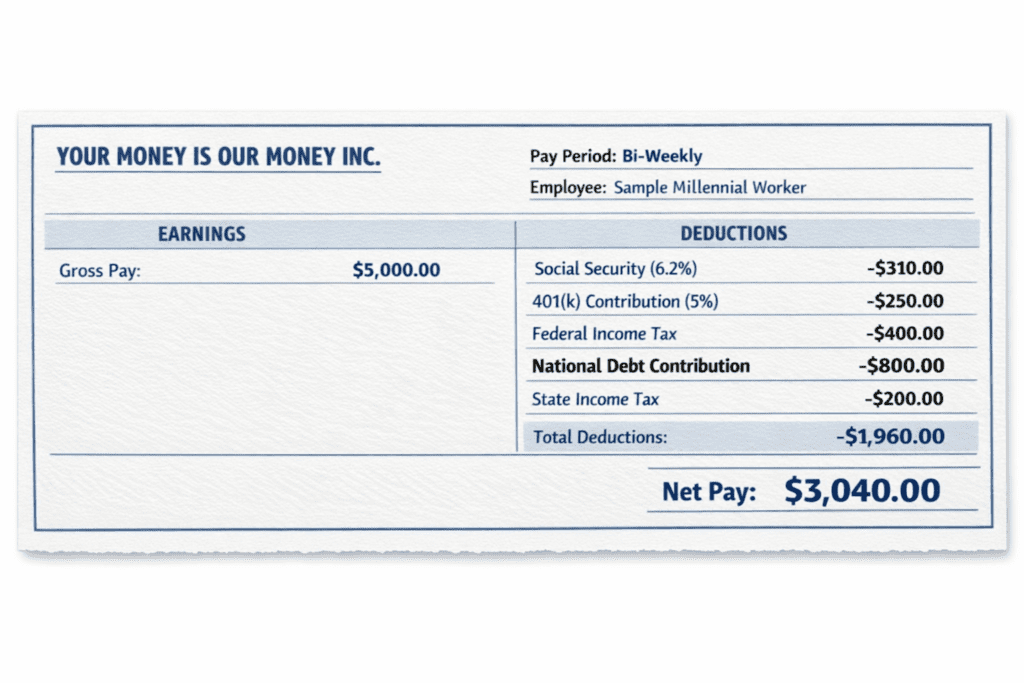
No announcement.
No line item on your pay stub.
No vote required.
This money doesn’t reduce the national debt. It doesn’t improve government services. It simply pays the carrying cost of money already spent.
We often hear that the U.S. government is “drowning in debt,” but that phrase is abstract. It doesn’t tell you what this means for your paycheck, your savings, or your future choices.
This article is meant to bring that concept home.
Because when it comes to money, there are only two sustainable paths: earn more or spend less. Individuals eventually learn this lesson — sometimes painfully. Governments, however, have avoided it for decades.
Both political parties have supported spending far beyond what the government earns. The result isn’t just a big number in Washington. It shows up quietly, indirectly, and relentlessly in everyday life. The national debt interest impact affects this and future generations.
So what does that actually mean for you?
Let’s get into the numbers.
- A Hard Number to Start With
- The Scale Problem: What the Debt Could Buy
- The Cost That Never Sleeps: Interest
- How This Directly Affects You
- Why Borrowing Raises Prices
- Case Study: The COVID Checks
- The Real Issue: Growth Rate
- Recent Federal Debt Growth by Year
- Other People’s Money: Why It’s Easier to Spend Than Your Own
- How to Protect Yourself in a High-Debt World
- 1. Hedge Against Future Tax Increases
- Use tax-diversified accounts
- 2. Lock in Fixed Costs Where Possible
- Housing as a hedge
- 3. Diversify Away From Pure Cash Exposure
- Build inflation-resistant exposure
- 4. Eliminate Variable-Rate Debt Aggressively
- Priority actions
- 5. Invest in Your Earning Power
- Strengthen your “human capital”
- A Simple Action Checklist
- Who Actually Pays Federal Taxes — and Why the Debate Gets Confusing
- Quiz
- What You Can Do Beyond Your Own Finances
- Questions to Ask Candidates
- Final Thought
- Authoritative Sources & Further Reading
- FAQ
A Hard Number to Start With
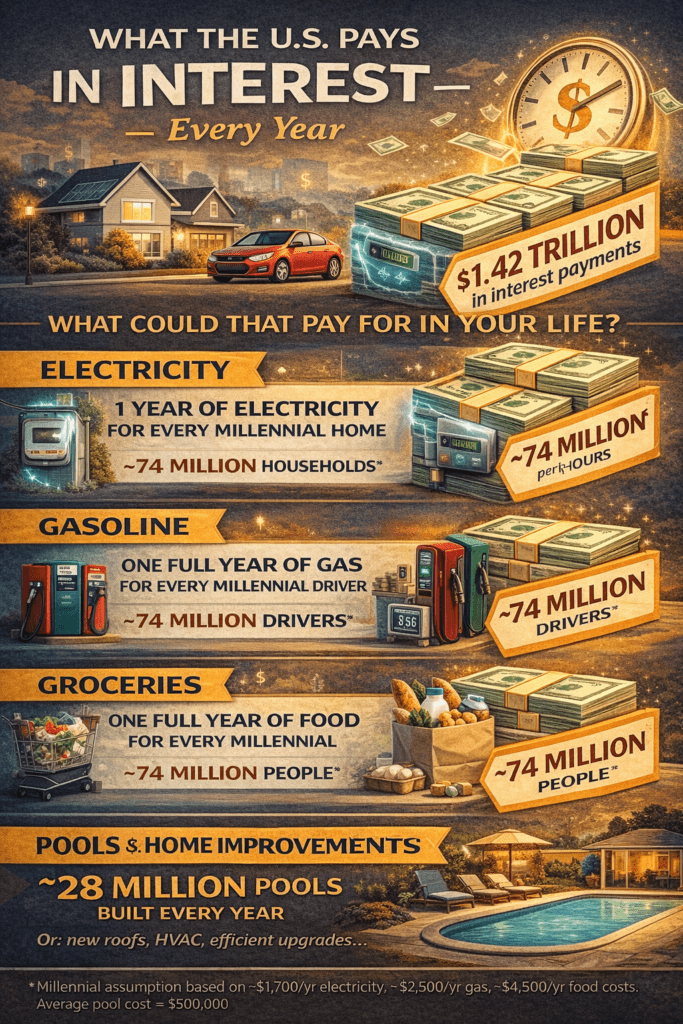
As of early 2026, the United States government is paying approximately:
- $1.42 trillion per year in interest on the national debt
- $3.9 billion per day
- $162 million per hour
- $2.7 million per minute
This money does not reduce the debt.
It does not fund services.
It simply pays for past borrowing.
And it runs continuously — day and night.
The Scale Problem: What the Debt Could Buy
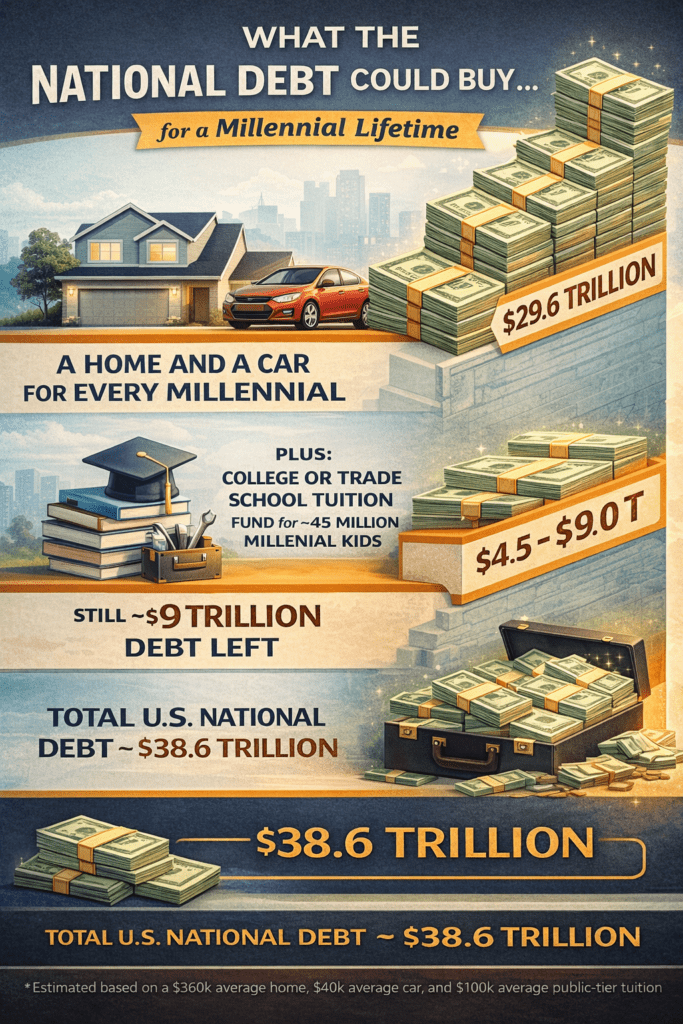
Trillions are hard to grasp. So let’s translate the current national debt — roughly $38.6 trillion — into things people can actually visualize.
A Home and a Car for Every Millennial
There are approximately 74 million Millennials in the United States.
Using conservative averages:
- Home: $360,000
- Car: $40,000
- Total per person: $400,000
That comes to $29.6 trillion.
In other words, the national debt is large enough to provide every Millennial with a home and a car — owned outright.
And even after that, there would still be about $9 trillion left.
Education for the Next Generation — Paid in Full
Millennials are now raising children. Estimates suggest there are roughly 45 million Millennial children today.
Using a conservative $100,000 per child — enough for either:
- A four-year public college degree, or
- A full trade or technical education
The remaining $9 trillion could:
- Fully fund education for every Millennial child
- In many cases, more than once
This comparison isn’t about policy.
It’s about scale.
The Cost That Never Sleeps: Interest
The debt itself is a long-term issue.
Interest is the daily pressure.
Every year, interest alone could instead pay for:
- Electricity for hundreds of millions of households
- Gas for every Millennial driver, multiple times over
- A full year of groceries for every Millennial adult
- Tens of millions of home upgrades — roofs, HVAC systems, insulation, or even a $50,000 backyard pool
Instead, that money disappears into servicing debt.
Not once.
Every year.

How This Directly Affects You
This isn’t abstract. It shows up in real life.
Imagine you run up $10,000 on a credit card at 20% interest. You can’t afford the payment, so you open another card to pay the first one.
The balance doesn’t go down.
The interest compounds.
And the cost keeps rising.
That’s effectively how the government services debt today.
To pay interest, it can:
- Borrow more
- Expand the money supply
- Allow inflation to absorb the cost
All three affect you.
Why Borrowing Raises Prices
Money behaves like a commodity.
When borrowing demand is low, interest rates stay lower.
When borrowing demand spikes — especially from the largest borrower in the economy — rates rise.
Because the government is considered the safest borrower, it gets the best terms. Everyone else pays more.
Businesses borrowing at higher rates raise prices.
Households borrowing at higher rates pay more.
Inflation spreads the cost quietly.
Inflation doesn’t announce itself as a tax.
But it reduces what your money can buy.
That’s why it’s often called the silent tax.
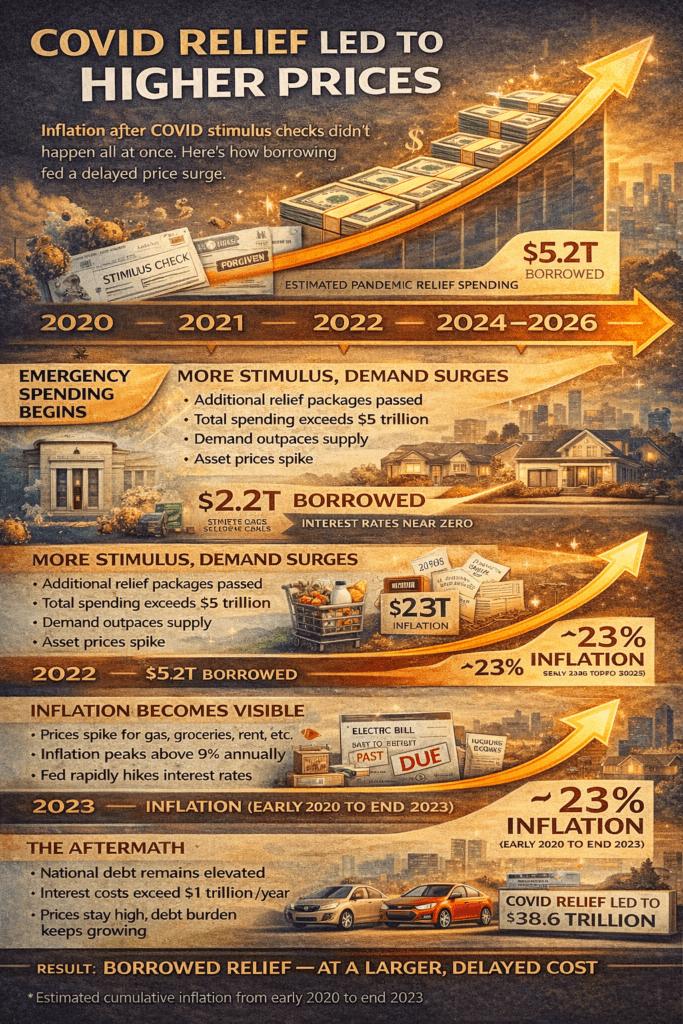
Case Study: The COVID Checks
During the COVID pandemic, the federal government approved over $5 trillion in emergency spending.
That included:
- Direct stimulus checks
- Forgivable business loans
- Expanded unemployment benefits
The government had no surplus to fund this. Nearly all of it was borrowed.
From 2020 through 2023:
- Cumulative inflation exceeded ~23%
- Prices rose across housing, food, vehicles, energy, and insurance
For many households, the long-term loss of purchasing power exceeded the value of the checks they received.
That doesn’t mean the relief had no short-term value.
It means the cost was delayed — and broadly shared.
Timeline: How It Unfolded
- 2020: Emergency spending begins, funded by borrowing
- 2021: Additional stimulus, demand rebounds faster than supply
- 2022: Inflation peaks above 9%, rates begin rising
- 2023: Prices reset higher permanently
- 2024–2026: Debt and interest costs remain elevated
The benefit arrived immediately.
The bill arrived gradually.
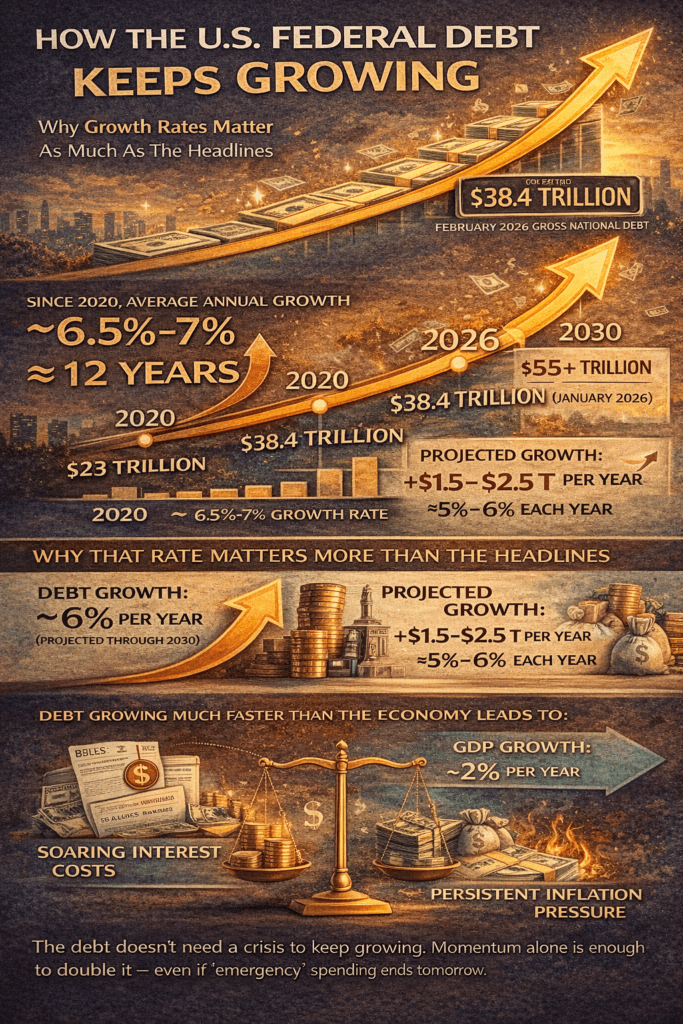
The Real Issue: Growth Rate
Since 2020, federal debt has grown at an average annual rate of ~6.5%–7%.
Over the same period:
- GDP growth has averaged ~2%
When debt grows 2–3 times faster than the economy, interest and inflation become structural — not temporary.
As of early 2026:
- Debt-to-GDP ≈ 121%
- Annual interest costs approach $1 trillion+
At this point, growth is baked in. National debt interest impact is severe.
Recent Federal Debt Growth by Year
| Fiscal Year | Total Debt (Approx.) | Annual Increase | Primary Drivers |
|---|---|---|---|
| 2020 | $26.9T | ~19.1% | COVID emergency spending |
| 2021 | $28.4T | ~5.6% | Continued pandemic relief |
| 2022 | $30.9T | ~8.8% | Infrastructure & recovery outlays |
| 2023 | $33.1T | ~7.1% | Rising interest rates |
| 2024 | $35.7T | ~7.8% | Higher borrowing costs |
| 2025 | $37.6T | ~5.3% | Structural deficits |
| 2026 (est.) | $39.0T+ | ~4%–6% | Interest & mandatory spending |
While the 2020 spike was exceptional, the years that followed show something more important:
👉 The debt never stopped growing at an elevated pace.
Other People’s Money: Why It’s Easier to Spend Than Your Own
One of the most important concepts in public finance is also one of the least discussed: when decision-makers spend money that isn’t theirs, they behave differently.
Elected officials don’t personally earn the money they allocate. Regardless of intent or motivation, the funds they spend are other people’s money. That distance makes it easier to approve large programs, absorb overruns, and postpone consequences.
This isn’t about good or bad motives. It’s about incentives.
Spending is always easier when the cost is:
- Distributed across millions of people
- Delayed over time
- Collected indirectly
That dynamic shows up repeatedly in debates about taxes, corporations, and wealth.
How to Protect Yourself in a High-Debt World
How to Protect Yourself in a High-Debt, High-Interest World
You can’t control federal deficits or national debt levels.
You can control how exposed your personal finances are to their consequences.
The most resilient approach is to play both offense (growing income and assets) and defense (reducing sensitivity to inflation, higher rates, and future taxes). The goal isn’t to predict policy — it’s to build a financial life that bends less when conditions change.
Here are the most effective strategies for Millennials as of 2026.
1. Hedge Against Future Tax Increases
When debt grows faster than the economy, governments eventually look for more revenue. Historically, that pressure shows up through higher effective tax rates, fewer deductions, or both.
Use tax-diversified accounts
- Roth accounts (Roth IRA / Roth 401(k))
Contributions are taxed today, but qualified withdrawals are tax-free. This effectively lets you lock in today’s tax rate and protect future income if rates rise. Use our calculator: ROTH Conversion Break-Even Calculator - Health Savings Accounts (HSAs)
HSAs offer triple tax advantages: deductible contributions, tax-free growth, and tax-free withdrawals for medical expenses. With healthcare costs rising due to demographics alone, HSAs are one of the most efficient long-term tools available. Use our calculator: HSA Calculator
You don’t need to go all-in — partial Roth exposure creates flexibility later.
2. Lock in Fixed Costs Where Possible
In a high-debt environment, inflation and higher interest rates become policy tools — not accidents. The more of your life that’s fixed, the less inflation can disrupt it.
Housing as a hedge
- Fixed-rate mortgages
A fixed mortgage payment stays the same even as inflation rises. Over time, you repay the loan with dollars that are worth less in real terms — effectively turning inflation into a tailwind. - Reality check for 2026 buyers
Entry costs are higher than in the past. Beyond interest rates, buyer-side commissions of 3% or more are increasingly common and raise the break-even timeline. Buying still makes sense for some — just model it carefully.
3. Diversify Away From Pure Cash Exposure
Cash feels safe, but in an inflationary environment, it quietly loses purchasing power.
Build inflation-resistant exposure
- Equities (stocks)
Over long periods, companies can raise prices and earnings, making stocks one of the best historical inflation hedges. - Real assets
Real estate, infrastructure, and commodities tend to retain value even when currencies weaken. - International diversification
Holding assets outside the U.S. dollar reduces concentration risk if U.S. debt pressures eventually weigh on the currency.
This isn’t about abandoning the U.S. — it’s about balance.
4. Eliminate Variable-Rate Debt Aggressively
As government borrowing increases, consumer borrowing costs become more volatile.
Priority actions
- Pay down high-interest, variable debt first
Credit cards, HELOCs, and variable personal loans are especially vulnerable to rate spikes. A 20% interest rate is a guaranteed negative return. - Resist lifestyle creep
With long-term costs likely rising faster than wages, keeping fixed expenses low today creates flexibility later.
Lower fixed obligations = more options.
5. Invest in Your Earning Power
Your skills are the asset least affected by inflation or policy changes.
Strengthen your “human capital”
- Negotiate intentionally
If your income isn’t rising at least as fast as inflation plus a performance premium, your purchasing power is shrinking. - Specialize
Scarce skills — advanced technical roles, healthcare, skilled trades, AI-adjacent work — remain in demand across economic cycles. Your ability to earn is your strongest long-term hedge.
A Simple Action Checklist
- ☐ Shift a portion of retirement savings to Roth accounts
- ☐ Lock variable-rate debt into fixed terms where possible
- ☐ Maintain a 6-month emergency fund in a high-yield savings account
- ☐ Diversify investments beyond a single asset class or currency
- ☐ Actively invest in skills that raise long-term earning potential
Who Actually Pays Federal Taxes — and Why the Debate Gets Confusing
A common claim in public debates is that “the rich don’t pay their fair share.”
The reality is more nuanced — and it depends heavily on which taxes you’re talking about.
There is an important distinction between:
- Federal Income Taxes, and
- Total Federal Taxes, which include payroll taxes like Social Security and Medicare.
When people talk past each other on this issue, this distinction is usually why.
What the Data Actually Shows
Based on recent IRS, CBO, Tax Foundation, and USAFacts data, the federal tax burden is highly concentrated at the top — especially for income taxes.
Share of Taxes Paid by Income Group
| Income Group | Share of Federal Income Tax Paid | Share of Total Federal Taxes Paid |
|---|---|---|
| Top 1% | ~40%–45% | ~25% |
| Top 5% | ~60%–62% | ~38% |
| Top 10% | ~72%–76% | ~50%–60% |
| Bottom 50% | ~2%–3% | ~10%–15% |
Two things can be true at the same time:
- A small group of high earners pays most federal income taxes
- Lower- and middle-income workers pay a much larger share of payroll taxes relative to income
Both statements are accurate — they just describe different parts of the system.
Why Income Tax and Payroll Tax Tell Different Stories
The argument that “top earners pay most of the taxes” is strongest when discussing federal income tax.
That’s because:
- Income tax rates are progressive
- High earners generate a large share of taxable income
However, when you include payroll taxes:
- Social Security taxes are capped
- Medicare taxes are flatter
- Lower- and middle-income workers contribute a much larger percentage of their earnings
That’s why the share shifts when looking at total federal taxes, not just income taxes.
Tax Shares vs. Tax Rates (An Important Distinction)
Another common misunderstanding is confusing share of taxes paid with tax rates.
For example:
- The top 1% earns roughly 22% of total adjusted gross income
- They pay roughly 40%–45% of federal income taxes
- Their effective federal income tax rate averages around 23%–26%
By comparison:
- The bottom 50% pays about 2%–3% of income taxes
- Their average effective rate is roughly 3%–4%
This doesn’t mean one group is “good” or “bad.”
It means the tax system is already highly concentrated — which matters for what comes next.
Why You Hear “Top 2%” So Often
The “top 2%” figure isn’t a formal IRS benchmark, but it’s frequently used in policy debates as shorthand for high-income earners.
While the top 2% alone does not pay a majority of all taxes:
- They contribute a very large share of federal revenue
- Policy changes aimed at this group have outsized ripple effects
When governments look to raise large sums quickly, this is often where they start.
Where This Connects Back to You
Here’s the key takeaway for Millennials:
When revenue becomes too concentrated:
- Governments have fewer places to go for additional funding
- Explicit tax increases become politically difficult
- Borrowing and inflation become the path of least resistance
Inflation doesn’t ask who paid income taxes.
It hits:
- Renters
- Wage earners
- Families
- Anyone holding cash instead of assets
That’s why inflation ends up functioning like a broad, quiet tax — especially damaging to people who rely primarily on income rather than wealth.
The Bigger Picture
This isn’t about defending one group or attacking another.
It’s about understanding incentives:
- Spending other people’s money is easier
- Borrowing delays accountability
- Inflation spreads the cost silently
And when that happens, Millennials — who already face higher housing, education, and living costs — tend to feel it first and longest.
Final Thought
You don’t need to predict the future to prepare for it.
You just need a financial structure that’s less fragile when debt, rates, and inflation move against you.
Stability isn’t built by guessing what policymakers will do —
it’s built by limiting how much their decisions can affect you.
If you’d like, the next logical step is to:
Or convert this section into a visual checklist or decision tree
Run a Roth vs. Traditional projection under higher future tax rates
Tie these strategies directly into your existing calculators
Tools matter when policy doesn’t change. The Millennial Financial Lab helps you plan for inflation, debt, and higher rates — before they hit your budget.
Quiz
What You Can Do Beyond Your Own Finances
There’s also a civic side.
- Become politically aware of how spending is funded
- Be skeptical of benefits without clear revenue
- Support individuals who demonstrate restraint, not just promise it
Fiscal responsibility isn’t about ideology.
It’s about math.
Questions to Ask Candidates
- How is this paid for?
- Is it temporary or permanent?
- What happens if revenue falls short?
- How does this affect debt growth over 10–20 years?
- What would you say “no” to?
Better questions lead to better incentives.
Author Insight
Your vote — and your support — shouldn’t belong to a political party.
It should belong to individuals who demonstrate financial restraint.
Rhetoric and pandering are how we accumulated record debt.
Accountability begins when behavior matters more than promises.
Final Thought
The debt explains the scale.
Interest explains the pressure.
Inflation explains why it feels personal.
You don’t need to predict the future to prepare for it.
You just need a financial life that bends less when policy doesn’t.
That’s how you stay ahead — even while you sleep.
This article requires far more than our simple discussion of national debt interest impact. Its a complex subject worth your time to read further.
Authoritative Sources & Further Reading
- U.S. Treasury – FiscalData (National Debt & Interest Costs)
https://fiscaldata.treasury.gov/americas-finance-guide/national-debt/
Primary source for total debt levels, interest payments, and Treasury data. - Congressional Budget Office (CBO) – Budget & Debt Projections
https://www.cbo.gov/topics/budget
Independent federal agency providing long-term debt, deficit, and interest projections. - Bureau of Labor Statistics (BLS) – Inflation & CPI Data
https://www.bls.gov/cpi/
Official source for inflation measurements and consumer price trends. - Federal Reserve Bank of St. Louis (FRED) – Debt, Rates & Economic Data
https://fred.stlouisfed.org/
Widely used economic database for interest rates, GDP growth, and monetary trends.
FAQ
Discover more from RetireCoast.com
Subscribe to get the latest posts sent to your email.


